
When forecasters think of the 500-millibar chart one of the top words that comes to their mind is VORTICITY. For operational purposes, vorticity can be thought of simply as a COUNTER-CLOCKWISE or CLOCKWISE spin. You already know that low pressure is associated with rising air and high pressure with sinking air. Similarly, a counterclockwise spin produces POSITIVE VORTICITY while a clockwise spin in the Northern Hemisphere produces NEGATIVE VORTICITY. The three elements that produce vorticity are SHEAR, CURVATURE, and CORIOLIS. Let's define each of these terms as they apply to 500 mb vorticity. SHEAR- A change in wind speed over some horizontal distance. Determined at 500 millibars by examining the spacing (and rate of spacing change) of height contours. CURVATURE- A change in wind direction over some horizontal distance. This change will result in either a counter-clockwise or clockwise curvature. CORIOLIS (aka EARTH)- Coriolis is the spinning motion created by the Earth's rotation. If you stood on the North Pole, your body would make a complete rotation in 24 hours. If you stood on the equator, your body would not spin (but rather would face straight ahead as the earth turns). Therefore, coriolis is a maximum and increases toward the poles and is a minimum and decreases toward the equator. Coriolis vorticity (also called earth vorticity) is zero at the equator, increases when wind flow is toward the pole and decreases when wind flow is toward the equator. Absolute vorticity = shear + curvature + f (coriolis) The magnitude and sign of each of these three terms determines the amount of absolute vorticity Now we need to know how these terms create positive or negative vorticity. This is given below. POSITIVE / INCREASING VORTICITY *Wind speed increasing when moving away from center point of trough. (positive shear vorticity) *A counterclockwise curvature in the wind flow. This occurs in troughs and shortwaves. (positive curvature vorticity) *A south to north movement of air. Coriolis increases (becomes more positive) when moving from the equator toward the poles. (increasingly positive earth vorticity) NEGATIVE / DECREASING VORTICITY *Wind speed decreasing when moving away from center point of trough. (negative shear vorticity) *A clockwise curvature in the wind flow. This occurs in ridges. (negative curvature vorticity) *A north to south movement of air. Coriolis decreases (becomes less positive) when moving from the pole to the equator. (decreasingly positive earth vorticity) There are 6 processes that can create vorticity, four are positive (earth vorticity is always positive in magnitude (except zero at the equator) but can increase or decrease depending on if the air flow is toward or away from the equator) and two are negative. It reasons that the more terms that are positive, the higher the value of absolute vorticity will be. The highest values of vorticity are found often just to the south or east of a highly amplified trough. To the right of the trough, winds will be from a southerly direction. This makes the coriolis term increasingly positive. Winds are generally light near the center of a trough with increasing winds away from the base of the trough. This makes the shear term positive. If the trough is highly amplified, this will give a positive curvature vorticity term. To clarify things further, lets look at a paper and pen representation of the 6 contributions to vorticity and these 6 contributions on a 500 mb chart. The term "negative earth vorticity" can be described as positive earth vorticity decreasing with time. The term "positive earth vorticity" can be described as positive earth vorticity increasing with time. Earth vorticity is always positive (with the only exception of being zero at the equator); earth vorticity ranges from zero at the equator to a value equal to the earth's angular momentum at the pole. 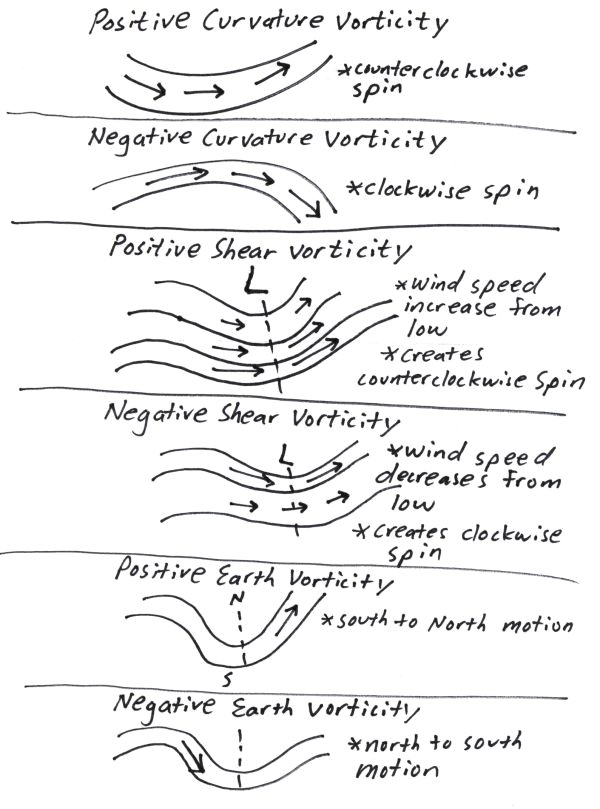 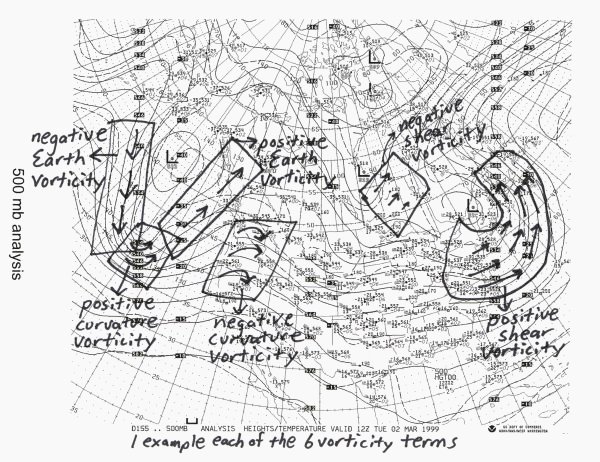 The image that follows shows the likely position of vorticity maximums. Again, vorticity maximums will be located in areas where the most vorticity terms are positive and largely positive in magnitude. When looking at a vorticity plot or a 500 millibar chart you should now know the processes in the atmosphere that are causing the vorticity (shear, curvature, coriolis vorticity (aka earth vorticity)). 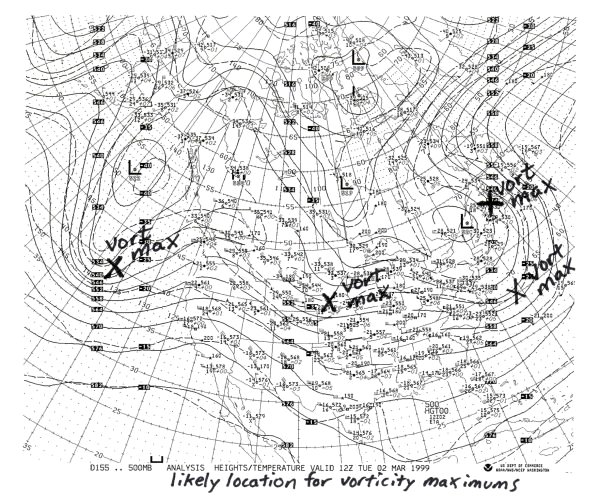 The strength of the wind is also very important. All else being equal, stronger winds will produce stronger vorticity in the base of a trough. The 500 millibars chart is the best for examining the overall trough/ ridge pattern. Underneath troughs, temperatures are cooler than normal while under ridges warmer than normal. 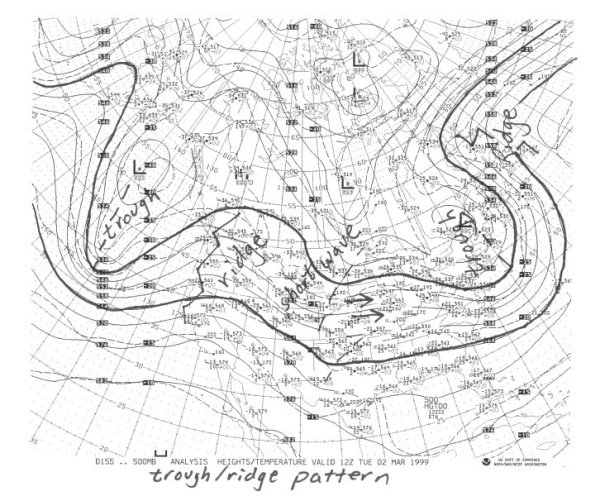 WHAT TO LOOK FOR: (1) This is the best chart to assess the magnitude of vorticity. Vorticity can be generated in three different ways. They are: a. Curvature vorticity b. Shear vorticity c. Earth vorticity (Coriolis) High vorticity is an indication of ageostrophic flow and upper level divergence (2) This is the best chart in assessing the trough/ ridge pattern . A trough is an indication of cooler weather and possible precipitation while a ridge is an indication of warmer weather and fair conditions. Greatest storminess is found to right of 500 mb trough axis. a. Zonal flow - air flow is generally west to east b. Meridional flow - highly amplified troughs and ridges (3) Use height falls and height rises to predict movement of troughs and ridges. Lows tend to develop toward regions with the greatest height falls while large height rises indicates a ridge is building into the area. (4) Temperatures at 500 mb are rarely above 0° Celsius. Temperatures can be above 0 ° Celsius at 500 mb in a hurricane due to the warm core nature of the storm. (5) Look for shortwaves within the longwave flow. The atmosphere will be unstable in association with shortwaves (baroclinic instability, ageostrophic flow). Precipitation is most likely to right of shortwave axis. The 500 and 700 mb charts are the best to use when locating shortwaves. Once you are familiar with what causes vorticity you can then assess vorticity advection. It is the advection of positive vorticity that contributes to divergence aloft (rising air). Below are links to online 500 mb data and further information CURRENT 500 MB DIFAX CHART 500 MB GRAPHICAL ANALYSIS CURRENT 500 MB MODEL VORTICITY INFORMATION ON CALCULATING UNITS OF VORTICITY |