
One of a forecaster's first thoughts when confronted with the 300/200 mb chart is the jet stream. The jet stream is a high velocity river of air that flows completely around the Earth at the mid-latitudes. During winter, the jet core is located generally closer to 300 millibars since the air is more cold and dense in the vicinity of the jet stream during the cool season. The 200 millibar chart is used for the jet stream in the warm season but either chart in most instances will suffice. Many hot air balloonists have tried to ride this river of air around the world with not much success for most. The river of air is not continuous. Embedded within the jet stream are higher velocity jet streaks. Jet streaks are segments of faster wind speed within the jet stream. At 300 mb, the air density is much smaller than near the surface. A 100-knot wind at the 200/300 millibar level does not feel as strong as a 100 knot wind at the surface. Even though the density is smaller, these air currents have the power to drive the movement of storm systems and build troughs and ridges. One jet streak can turn a beautiful Monday into a severe storm Tuesday, as we will see in an example later. Troughs and ridges are not only carved by warm air and cold air advection but also by the high momentum air of jet streaks. A significant jet streak has winds over 100 knots. Look at the 300 mb chart in this section labeled "Time 1". A jet streak exists from Colorado to Montana. The highest wind speeds in the jet streak (aka jet core, jet surge) are 130 knots (150 miles per hour) in southern Wyoming. Parcels within the jet streak are diving to the southeast. The air's momentum forces a trough to develop across the Central US. In "Time 2", the chart from 12 hours later, the jet streak has moved further to the southeast and the associated trough is becoming more amplified. At "time 3" the jet streak has turned the corner and is in the base of the trough. The trough is at maximum amplification. The trough will now move to the east and eventually to the northeast. It is difficult to determine the four quadrants of a jet streak when one "turns the corner". Divergence and rising motion are strongest to the north of the jet axis, such as in Tennessee during highly curved jet streaks. RULE OF THUMB: If a jet streak exists on the left side of a trough and winds are stronger to the left of the trough (as it is in our example in "Time 1"), the trough will become more amplified with time and will "dig" in a southerly direction. If a jet streak exists on the right side of a trough and winds are stronger to the right of the trough, the trough will become less amplified with time and "lift out" in a northeasterly direction. If the winds are about the same on each side of the trough, it will stay at about the same amplification. This knowledge will make you a better forecaster! A jet streak progression is shown below. 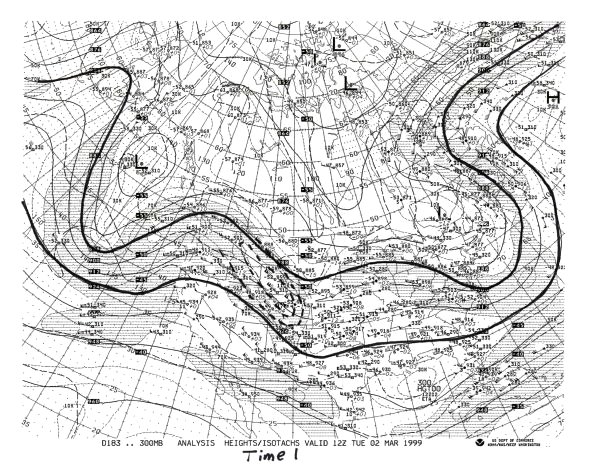 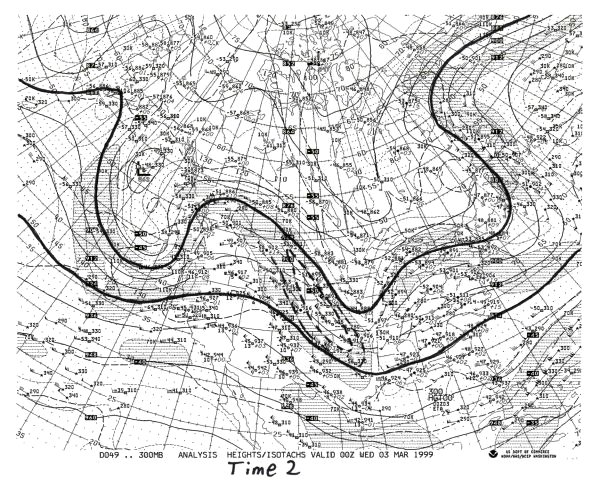 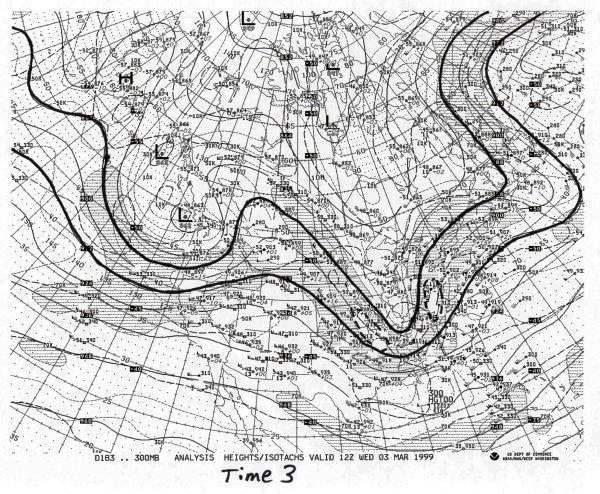 The jet stream is useful for the prediction of temperature. The jet stream divides colder air to the north from warmer air to the south. The transition between temperatures on each side of the jet is very abrupt. Heights are higher to the south of the jet and lower to the north. In the upper levels, this creates relatively high heights to the south of the jet and relatively low heights to the north. The Pressure Gradient Force flows from a southerly to northerly direction. However, the Coriolis force shifts the wind flow to the right of the path of motion. Therefore, the jet stream flows from the west to east. When a trough builds over a region it often indicates cooler temperatures due to cloudier weather and northerly winds. A ridge builds by low level (between the surface and 700-mb) warm air advection and upper level forcing (negative vorticity). Air in a ridge is sinking and is thus expanding and creating higher heights. Therefore, temperatures are warmer than normal in a ridge due to warmer temperatures and sunnier weather. This is especially true when a ridge occurs in high latitudes. Below is a diagram showing the development of the polar jet and the wind pattern the PGF and Coriolis produce. 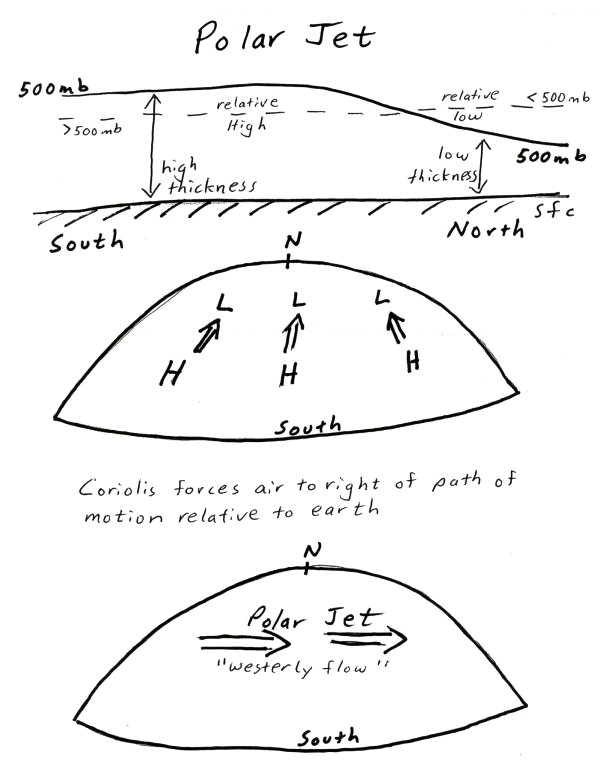 Certain regions of jet streaks are more favorable for rising or sinking air. Where convergence occurs in the upper levels, sinking motion results. Where divergence (evacuation of mass) occurs in the upper levels, rising motion result. Convergence and divergence in a jet streak is caused by an imbalance of forces as a parcel accelerates into a jet streak then decelerates out of the jet streak. The depiction below shows the balance and imbalance of forces in a jet streak. Lets look at each of the 5 numbers and letters. 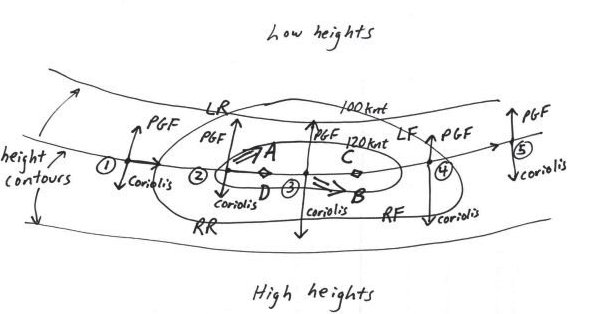 (1) Pressure Gradient Force and Coriolis are in balance. Wind is geostrophic (parallel to height contours) (2) Parcel enters region of higher wind speed. This increases the Pressure gradient force at the same time the Coriolis has not been changed much. Wind will tend to flow toward the longest vector, which is the PGF. This causes convergence in the Left Rear Quad (sinking air at letter A) and divergence in the Right Rear Quad (rising air at letter D). The tropopause is just above jet stream level. Convergence at the jet stream level forces air to sink because the highly stable tropopause prevents air from rising. (3) The Coriolis once again balances the Pressure Gradient Force. (4) As a parcel leaves the jet streak it must decelerate. The Pressure Gradient Force weakens at the same time the Coriolis has not had time to adjust and decrease. This causes convergence in the Right Front Quad (sinking air at letter B) and divergence in the Left Front Quad (rising air at letter C). (5) Pressure Gradient Force and Coriolis once again balance This example has been for a jet streak in a zonal flow. A jet streak in a curved flow, such as the case when a jet streak is in the base of a trough, will have divergence and rising air to the north of the jet and convergence and sinking air to the south of the jet. The jet stream is a powerful forecasting tool. Not that it can give exact highs/ lows/ and precipitation chances, but because it gives information such as when to expect the next storm system and whether temperatures will be above or below normal. It gives clues to how the upper levels will promote rising air or sinking air. It gives clues to the character of the next storm system. Jet streaks alone provide much information of how a trough or ridge will develop over the next couple of days. WHAT TO LOOK FOR ON 300/250/200 chart: (1) Jet stream *The jet stream is a river of air with segments of higher speed winds embedded within the mean flow *Areas North of jet stream tend to have cooler than normal temperatures especially in the mid-latitudes *Areas South of jet stream tend to have warmer than normal temperatures, especially in higher latitudes (2) Jet Streaks *Rising air occurs in the right rear and left front quadrants of jets *Sinking air occurs in the left rear and right front quadrants of jets *Rising air occurs north of jet axis if jet is in a highly curved flow *Winds over 120 miles per hour constitute a significant jet streak *Upper level divergence enhances rising air, especially if warm air advection is occurring in lower levels of atmosphere (3) General trough/ridge pattern *Momentum of jet stream carves the trough ridge pattern. If the jet stream winds are greater on the LEFT side of a trough, the trough will become more amplified and move further south. If the jet stream winds are greater on the RIGHT side of a trough, the trough will become less amplified with time and move further north. CURRENT 300 MB INITIALIZATION CURRENT 250 MB ANALYSIS CURRENT 200 MB ANALYSIS |