
Notice the strong temperature gradient (gradient of color) across the central U.S. on the 850 mb image below. Temperature are much higher in the western Plains than in the eastern United States. Since thickness is a function of the average temperature of a layer of air, then there will be a thickness gradient in the same region that the temperature gradient occurs. This thickness gradient can be seen on the thickness chart below (dashed lines). The thickness shown is the 1000 to 500 mb thickness. A forecaster will use these two model images to assess thermal advection. When strong thickness advection occurs, a forecaster knows that thermal advection is occurring also. Warm Air Advection is occurring across the central U.S. This is seen by the wind vectors at 850 mb moving the isotherms toward the east over time. The thickness lines will move to the east also in the central U.S. Strong Warm Air Advection in the lower troposphere contributes to a lifting of air. Clouds and precipitation chances can be expected in these regions especially if the air being lifted is saturated. Examples are from UNISYS weather. For current forecast model products visit: UNISYS 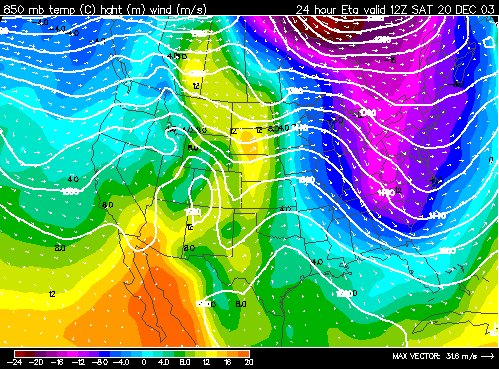 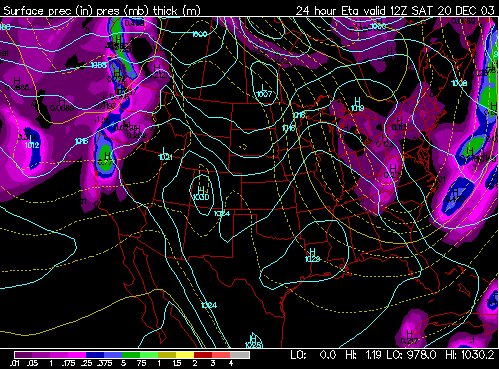
|