
For operation purposes a forecaster can usually safely assume that the (Positive Vorticity Advection) PVA is differential. Therefore, I will leave off the D for the remainder of this essay. If PVA is differential then upper level divergence is stronger than low level convergence and thus a rising motion ensues (divergence increases with height). There is not a weather chart I know of that shows "values" of PVA. In the absence of other synoptic forcing mechanisms, the synoptic UVV prog can be used to assess the relative magnitude of PVA. The individual forecaster must interpret PVA with relative values such as strong, moderate, weak, nonexistent. A vort max or any value of vorticity is NOT a "value" of PVA (One 32-unit vort max may have strong PVA downstream from it while another 32-unit vort max may have weak PVA downstream from it). PVA literally means the advection of positive values of vorticity. On a 500-mb vorticity chart there are 2 items that must be studied in order to find a region of PVA. They are the height contours and the lines of vorticity. The angle of intersection between the height contours and the lines of vorticity is also important to study. I do not know of a "iso" term for equal values of vorticity. I will call them vorticity isolines. For this essay I will use the UNISYS graphical output and explain how to interpret it: http://weather.unisys.com/nam/500.php Vorticity isolines are denoted by colors and the height contours are denoted by white lines. The graphic below shows both of these entities. The remainder of the essay will be spent interpreting where PVA is occurring in this image. 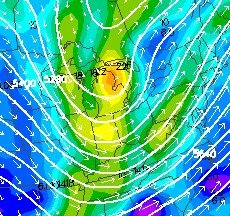 Height contour spacing has a relationship with wind speed (length of wind vectors). Where close contour spacing occurs wind will be stronger (longer wind vectors). PVA occurs where a wind vector flows through the lines of vorticity from higher values toward lower values of vorticity (in other words higher value of vorticity are advecting downstream). The technical cause of uplift in a region of PVA is due to divergence produced by parcels of air moving through a vorticity gradient from higher toward lower values of vorticity. A high value of vorticity does NOT indicate PVA and uplift by itself. PVA occurs where there is a wind flow through the lines of vorticity from higher toward lower vorticity values. PVA occurs downstream from higher values of vorticity if again the wind is flowing through the vorticity gradient. PVA will be relatively highest where there is the best combination of long wind vectors, tight vorticity isolines downstream from vort max / lobe and wind vectors fairly perpendicular to vorticity isolines. On the image the longest wind vectors are south of the vort max. The tightest vorticity isolines downstream from the vort lobe extends from lake Huron, western lake Erie and into western Ohio. Notice how short the wind vectors are underneath the vorticity max over Michigan. If the wind is light, then PVA downstream from the vort max / lobe will be subsequently small. The greatest combination of long wind vectors, perpendicular advection and close vorticity isolines is over western Ohio in the image above. Advection of vorticity is maximized if the strong wind vectors are perpendicular to the closely spaced vorticity isolines (a good example is the wind vector in west central Ohio). If the wind vectors are parallel to the vorticity isolines then NO vorticity advection can take place (a good example is over eastern Lake Huron where the angle is far from being perpendicular). The image below is another example of weak PVA because the wind vectors are parallel to the vorticity isolines. This commonly occurs with cut-off lows and tropical lows. 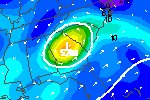 The best PVA is not always downstream from the region with the highest values of vorticity. The vorticity isoline gradient could be weak in the vicinity of the vort max / lobe or the winds could be moving weakly through the vort max. A beginning forecaster will sometimes incorrectly associate a vort max with the region of greatest upper level divergence. PVA is NOT under the vort max but is rather in the downstream area from it. Any variation in the vorticity isoline spacing, wind speed or angle the wind vectors intersect the vorticity isolines over space and time will change the advection of vorticity and will subsequently change the magnitude of PVA. In a situation where there is a vort lobe, in the downstream region of the vort lobe, some areas within the region will have greater PVA than others depending on variations in vorticity isoline spacing, wind speed and the angle of intersection between vorticity isolines and wind vectors. |