
The Surface Chart *Many more observation sites than on upper air charts *More frequently updated than upper air charts *Isobars are the solid lines (they are NOT height contours) *Surface observation gives temperature, dewpoint, pressure, wind, pressure tendency, weather, sky cover *Unlike the upper air charts, this chart is not at a constant pressure level for each observation of temperature, dewpoint, and wind *Frictional force is significant on this chart. Turns wind about 30 degrees toward low pressure. This causes convergence into low pressure regions. Friction also causes wind to be more variable, especially when winds are below 10 miles per hour. *Strong fronts will cause "kinking" of isobars What to look for: (1) Advections: warm air advection, cold air advection, moisture advection (2) Fronts: cold fronts, warm fronts, troughs, outflow boundaries, occluded fronts, stationary fronts, drylines (3) Pressure: High pressure regions, low pressure regions (4) Convergence, divergence, confluence, diffluence (5) Temperature and moisture gradients (6) Influence of topography upon the weather conditions ONLINE locations for surface charts: METAR PLOT- multi-hour updates UNISYS SURFACE- hourly update DIFAX- three hour update ABOUT THE SURFACE CHART If forecasting has to be performed from just one chart, many forecasters would choose the surface chart. It has a wealth of observations and it is the weather experienced by humans since it is at the surface. Unlike the upper air charts that only come out twice per day, the surface chart can be updated as much as multi-hourly, hourly or in three-hour increments. Understanding pressure contour lines (isobars) is the key to interpreting the chart. Without understanding isobars, temperature advection, wind speed/direction and pressure distribution the surface chart can not be comprehended. Upper air charts are at a fixed pressure level; temperature, dewpoints and wind are reported from that pressure level. This is not true for the surface chart with the exception of pressure. Temperature, dewpoint and wind information are gathered from observation stations just a few feet above the surface for all elevations. Pressure, however, is normalized so pressures at high elevation stations can be measured against pressures at low elevation stations. All stations, no matter the elevation, are given the station pressure the site would have if it were at sea level. In a place such as New Orleans, the surface pressure will be very close to the station pressure. But in a city like Denver, the station pressure may be 150 millibars less than surface pressure. Once each location has a sea level pressure, they can be compared to each other to determine where relative low and high pressures are distributed across the map. Another huge difference between surface and upper air charts is the marking of fronts. They are marked on surface charts but not on upper air charts. Temperature advection and height contour kinking must be used to infer upper air fronts. With a large number of reporting stations at the surface, a fairly accurate position of fronts is possible. With far less reporting stations on upper level charts it is more difficult to obtain exact frontal position. Besides, there are only two upper air charts per day. Fronts do not pass a reporting station at all levels in the atmosphere at the same time. The upper level front can pass BEFORE or AFTER the surface front. If the upper level winds are strong, the upper level front may advect out ahead of the surface front. Friction is strongest at the surface, which can impede surface front movement. In the case of a shallow polar front, the surface front will pass before the upper level front (i.e. 850 mb front). Severe weather becomes more likely if the upper level front moves in before the surface front. Cold air above warm surface air promotes thermodynamic instability. This situation is common with a strong mid-latitude cyclone. Use Skew-T diagrams and the upper level charts to see how a front slopes with height. Temperature advection and Moisture advection are important elements to study on surface charts. This will be examined in detail in the next section on the 850 mb analysis chart. Warm air advection and moisture advection near the surface will cause the low levels of the atmosphere to become increasingly unstable. Air expands and becomes less dense by either warming or adding moisture to the air. If both of these take place at the same time, such as the advection of mT air, the atmosphere will rapidly become unstable. A key word to remember is advection. Just because a mT airmass is in place DOES NOT mean the atmosphere is rapidly becoming unstable. The surface temperature must be increasing rapidly and the dewpoint increasing rapidly for the atmosphere to rapidly become unstable. If the morning temperature and dewpoint are 60/47 and the afternoon temperature and dewpoint are 87/70, a large amount of warm air advection (WAA) and moisture advection have taken place throughout the day. If a trigger mechanism is near by, strong storms are very likely. It is likely the upper and mid-levels of the atmosphere are not experiencing the same magnitude of WAA and moisture advection. WAA and moisture advection in the low levels will increase instability since the upper levels are at the same temperature or may even be cooling. If a mT airmass extends from the surface to the upper levels of the atmosphere, severe weather is not as likely. Look for differential advection for severe weather (mT air in low levels with cT or cP air in midlevels of atmosphere.) In the low levels, processes of convergence, divergence, confluence, and diffluence should be analyzed. Convergence and confluence in the low levels leads to rising motion while divergence and diffluence to sinking motion. Once air converges at the surface it has no place to go but up. Convergence is stronger winds moving into weaker winds in the same line of action. Think of this as cars approaching a tollbooth. The cars are restricted to a straight line of action, the road. The cars have to slow and convergence to pay the toll. After leaving the tollbooth, the cars diverge (increase in speed after leaving the booth). Confluence and diffluence involve winds approaching each other with different angles. These terms are shown graphically below. 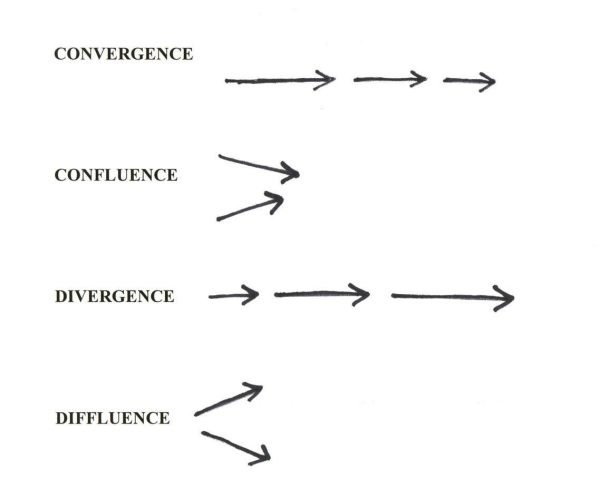 |