
In 2007, Georgia experienced exceptional drought conditions which had dire consequences for the state. According to GeorgiaDrought.org, outdoor watering bans were declared for the northern third of the state by late September. Two months later, the U.S. Army Corps of Engineers documented that Lake Lanier, a water source for Atlanta, recorded its lowest level ever. Then, in early 2008, Georgia attempted to alter its northern border with Tennessee in an attempt to tap into the Tennessee River (Kauffman). In addition to the drought, Georgia endured several months with above average temperatures in 2007. This culminated in August, when four cities experienced triple digit readings, breaking several records. The reduction in soil moisture, as a result of the drought, played a crucial role in Georgia's record-breaking heat. Oliver and Hidore define a meteorological drought as an abnormal period of time, over several months or years, when the water supply drops below what is normally expected for a region (177). Droughts can be induced by several factors, although persistent high pressure often emerges to the forefront as the main culprit. Under high pressure, a forecast area typically experiences sinking air, which results in compressional warming and lower relative humidity. Sinking air also hinders cloud development which reduces a region's rainfall. While most areas experience high pressure from time to time, persistent high pressure over several months or longer, can induce drought conditions (National Drought Mitigation Center). La Nińa has also been cited as a cause of drought in the southern U.S. In February 2007, the National Oceanic and Atmospheric Administration (NOAA) predicted that a La Nińa was about to begin, and in November, confirmed that a moderate one was in progress. Cooler than usual sea surface temperatures in the central and eastern equatorial Pacific indicate that a La Nińa is in progress. The effects of La Nińa alter rainfall and wind patterns across the tropical Pacific Ocean which ultimately impact global rainfall and temperature patterns. La Nińa usually develops between March and June, peaks between December and February, and weakens the following March through May. According to NOAA's La Nińa information web site, La Nińa generally brings dryer and warmer than average conditions to the southern U.S., which peak during the winter months and can sometimes lead to a more active Atlantic hurricane season. Georgia began to dry out in early 2007, and after an active Atlantic hurricane season never came to fruition, a drought was in full swing by late summer that continued into the following year. Droughts are naturally recurring climactic events. An exceptional drought occurs once every 100 years, an extreme drought happens every 50 years, while a severe drought takes place every 20 years (Stooksbury, May and August 2007). According to Georgia climatologist David Stooksbury in 2003, the last four long-term droughts in the state occurred from 1998-2002, 1954-1956, 1925-1927, and 1896-1899, with minor droughts occurring in between these periods. Another period was perhaps initiated in late 2006, when the National Weather Service Forecast Office (NWSFO) in Peachtree City, Georgia, documented in its 2006 Climate Summary that Athens, Atlanta, Columbus, and Macon, ended the year with rainfall deficits ranging from 1.74 to 10.38 inches. In its 2007 Climate Summary, the same NWSFO reported that the first three months of the year were dry and that drought conditions worsened to extreme over much of North and Central Georgia by late spring. In April, Athens and Atlanta received less than half their average rainfall. In May, Macon received a trace of rain while Columbus saw its second driest May ever. By late July, rainfall deficits in the four cities ranged from 2.84 to 13.9 inches. It is difficult to pinpoint exactly when the most recent Georgia drought began. Was it during the latter half of 2006, the early part of 2007, or the fall of 2007 after the weaker than anticipated hurricane season? Lutgens and Tarbuck point out that this is one of the issues with forecasting drought because it happens gradually, over time, and its effects may be felt long after the drought has ended (444). Additionally, there is not a universally accepted definition of drought, as it depends on regional conditions that examine several factors. In August 2007, Stooksbury identified these factors as rainfall over long-term and short-term periods, soil moisture, stream flows, and the levels of groundwater and reservoirs. The Palmer Drought Severity Index (PDSI) attempts to address the issue of forecasting long-term drought conditions. NOAA states on its PDSI web site that the index utilizes temperature and rainfall data to calculate dryness. It is most effective in determining long term drought and is standardized to local climate, which makes it applicable to any part of the country. The PDSI recognizes zero as normal, while drought is indicated by negative numbers. For the week ending August 25, 2007 (see Figure 1), the PDSI categorized roughly 22% of Georgia in the moderate drought category (-2), 55% in the severe drought category (-3), and 33% in the extreme drought category (-4). In support of this, Stooksbury reported earlier in August that of the 159 Georgia counties, drought conditions were exceptional in 37, extreme in 55, and severe in 16. Both the Palmer Drought Index and Stooksbury establish that Georgia was in the midst of a drought in August 2007. One consequence of the Georgia drought was a reduction in soil moisture across the state, which led to record-breaking temperatures. Soil moisture anomaly calculates the departure of soil moisture from normal levels. According to the Climate Prediction Center's soil moisture web site, by July of 2007, Georgia soil moisture anomalies ranged from -60 mm. to -160 mm. (see Figure 2), while in August, they ranged from -20 mm. to -120 mm (see Figure 3). Additionally, Stooksbury reported on August 8 that soil moisture was near the first percentile in northwest and southwest Georgia and between the 2nd and 5th percentiles across the extreme drought region of the state. This indicates that the soil would be moister in 99 of 100 years and would be moister in 95 to 98 of 100 years, respectively. Due to evaporational cooling, regions with high soil moisture typically experience cooler high temperatures during the day due to latent heat absorption. Regions will lower soil moisture generally experience less evaporational cooling which allows for more incoming solar radiation to be converted directly to sensible heat. In Georgia, this reduction in soil moisture translated to less evaporational cooling which results in warmer temperatures. The reduction in soil moisture evaporation into the atmosphere also makes less water vapor available for condensation which then resulted in increased solar radiation. The August 2007 NWS Monthly Weather Summaries for Athens, Columbus, and Macon reported no cloudy days while Atlanta saw only three. Athens, Columbus, and Macon each saw four or less partly cloudy days. This reduction in cloud formation creates a decrease in the formation of air mass thunderstorms which would provide cooling to the air in the form of rain. Summertime thunderstorms are common in the climatology of North and Central Georgia yet the August 2007 NWS Monthly Summary reported only three days with thunderstorms for Macon and five for Athens. Furthermore, the Peachtree City, Georgia NWSFO confirmed in its 2007 Climate Summary that there was "spotty and infrequent late day convective activity." The reduction in soil moisture brought about by the drought, led to less evaporational cooling, and fewer clouds and thunderstorms which impacted the record heat. In August 2007, Athens, Atlanta, Columbus, and Macon experienced their warmest readings of the year. Atlanta tied a record for the most 100 degree readings, with five in one month, and hit 104 on August 22, setting the all-time high for August. Athens reached 106 on August 22, tying the record for that date, and missing the August record high by one degree. Columbus tied its all time record of 104 on August 10, and saw six days of 100-plus degree days that month. On August 10, Macon also tied its record high of 105 and experienced a total of 12 days with highs at or above 100. By the end of the month, Atlanta had felt its warmest month ever with an average monthly temperature of 85.6 degrees. August 2007 tied for Athens' warmest month, Columbus saw its warmest August and third warmest month ever, and Macon tied its previous record for the warmest August and experienced its fourth warmest month ever (NWS 2007 Climate Summary). In conclusion, the reduction of soil moisture during the Georgia drought resulted in reduced evaporational cooling which set the stage for record-breaking heat of August 2007. Persistent high pressure, generally with lack of cloud cover and rainfall initiates the drought in the first place, which then leads to decreased soil moisture. The reduction in soil moisture acts as a feedback mechanism that results in less evaporational cooling, and even fewer clouds and thunderstorms, which further exacerbates the drought. This illustrates the fact that all of these components are interdependent in creating and sustaining drought conditions. When will this drought end? As of this writing in April 2008, year-to-date rainfall totals are below average in Athens, Atlanta, and Macon while Columbus is slightly ahead. It is too early to determine when this current drought will be over as well as how long its impacts will be felt across Georgia. 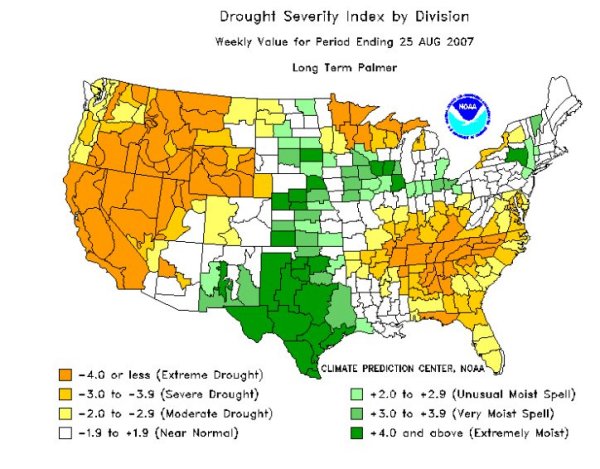 Source: Drought Severity Index by Division: Weekly Value for Period Ending August 25, 2007. August 25, 2007. Climate Prediction Center. March 29, 2008. http://www.cpc.noaa.gov/products/analysis_monitoring/regional_monitoring/ palmer/2007/weekly_PALMER_2007.html.  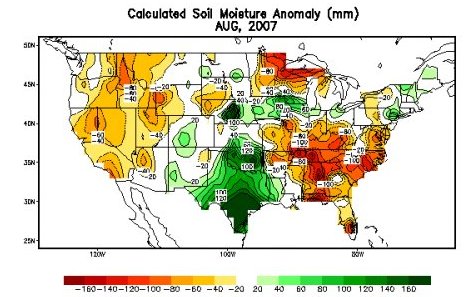 Source: Soil Moisture. February 22, 2005. Climate Prediction Center. March 29, 2008. http://www.cpc.ncep.noaa.gov/soilmst/w.shtml. Works Cited 2006 Climate Summary for North and Central Georgia. January 1, 2007. National Weather Service Forecast Office, Peachtree City, GA. March 22, 2008. http://www.srh.noaa.gov/ffc/html/clisum06.shtml. 2007 Climate Summary for North and Central Georgia. January 1, 2008. National Weather Service Forecast Office, Peachtree City, GA. March 22, 2008. http://www.srh.noaa.gov/ffc/html/clisum07.shtml. August 2007 Monthly Weather Summaries for Athens, Atlanta, Columbus, and Macon. September 4, 2007. National Weather Service Forecast Office, Peachtree City, GA. March 29, 2008. http://www.weather.gov/climate/index.php?wfo=ffc. Citing Historic Drought, Georgia EPD Bans Most Outdoor Water Use in North Georgia. September 28, 2007. Georgia Department of Natural Resources. GeorgiaDrought.org. April 10, 2008. http://www.caes.uga.edu/topics/disasters/drought/pdf/sep2807.pdf. El Nińo/Southern Oscillation (ENSO) Diagnostic Discussion. November 8, 2007. Climate Prediction Center/NCEP/NWS. April 7, 2008. http://www.cpc.ncep.noaa.gov/products/analysis_monitoring/enso_disc_nov2007/ensodisc.pdf. Hidore, John J., and John E. Oliver. Climatology: An Atmospheric Science. Prentice Hall: Upper Saddle River, NJ. 2002. 176-178. Kauffman, Elisabeth. The (Water) War Between the States. March 7, 2008. Time.com. April 10, 2008. http://www.time.com/time/nation/article/0,8599,1720641,00.html. Midnight Pools at Buford. December 26, 2007. U.S. Army Corp of Engineers. April 10, 2008. http://water.sam.usace.army.mil/gage/acf/prob1.txt. La Nińa Information. National Oceanic and Atmospheric Administration. April 7, 2008. http://www.publicaffairs.noaa.gov/lanina.html. La Nińa May Soon Arrive. February 28, 2007. National Oceanic and Atmospheric Administration. April 7, 2008. http://www.noaanews.noaa.gov/stories2007/s2805.htm. Lutgens, Frederick K., and Edward J. Tarbuck. The Atmosphere: An Introduction to Meteorology. Prentice Hall: Upper Saddle River, N.J. 2004. 444-445. The Palmer Drought Severity Index. National Oceanic and Atmospheric Administration. March 29, 2008. http://www.drought.noaa.gov/palmer.html. Drought Severity Index by Division: Weekly Value for Period Ending 25 August 2007. August 25, 2007. National Oceanic and Atmospheric Administration. March 29, 2008. http://www.cpc.noaa.gov/products/analysis_monitoring/regional_monitoring/ palmer/2007/weekly_PALMER_2007.html. Soil Moisture Anomalies for July and August 2007. February 22, 2005. Climate Prediction Center. March 29, 2008. http://www.cpc.ncep.noaa.gov/soilmst/w.shtml and http://www.cpc.ncep.noaa.gov/soilmst/wfull_mm_frame.html. Stooksbury, David E. Historical Droughts in Georgia and Drought Assessment and Management. Proceedings of the 2003 Georgia Water Resources Conference, held April 23-24, 2003 at The University of Georgia. Kathryn J. Hatcher, editor, Institute of Ecology, The University of Georgia, Athens, Georgia. April 5, 2008. https://www.piersystem.com/clients/1619/89374.pdf. Stooksbury, David E. Extreme, severe drought expand across Georgia. May 21, 2007. Georgia Faces. April 7, 2008. http://apps.caes.uga.edu/news/viewtext.cfm?id=3133. Stooksbury, David E. Drought worst yet in northwest, southwest Georgia. August 8, 2007. Georgia Faces. April 7, 2008. http://georgiafaces.caes.uga.edu/viewtext.cfm?id=3189. What is Drought? 2006. National Drought Mitigation Center. April 5, 2008. http://www.drought.unl.edu/whatis/predict.htm. |