
Being the smallest continental state west of the Appalachian Mountains, Indiana is a relatively flat state in terms of its topography. The elevation ranges from a low point of 320 feet above sea level in the far south to a high point of 1,257 feet above sea level in the north. Most of the state however averages around 700 feet with a general slope from north to south toward the Ohio and Wabash Rivers in the southwestern portion of the state. Additionally, Indiana is part of the Great Midwestern Corn Belt, therefore predominantly covered by vast farm land with small urban developments peppered throughout the state. Although the soil is well-drained, fertile, and ideal for agriculture, the very nature of the state's topography can lead to devastation, primarily as a result of general and flash flooding from over-flowing rivers and other bodies of water. 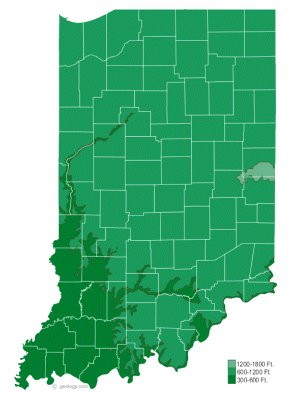 As with any state, Indiana has an immense network of streams, lakes, and rivers, all of which are capable of overflowing their banks and causing widespread damage to property and potential loss of life. The focus of this commentary will be on Central Indiana, home to the state's capital, Indianapolis, and the difficulties of forecasting generalized flooding in the region. The emphasis will center on the west fork of the White River, the area's major tributary that runs through the city and eventually empties into the Wabash and Ohio Rivers downstream. The ultimate destination of these drainage basins is the Mississippi River and the Gulf of Mexico. Indiana is geographically located in an area subject to a typical trough-ridge pattern throughout much of the year. This pattern and the associated Low pressure systems that frequently ride along it, put Indiana in the direct path of these moisture-latent storms, which is even more pronounced throughout the northern hemisphere winter months. Although flooding can, and does, occur in any season, it is in the winter and early spring that the problem is often magnified. It is the abundance of moisture coupled with the rapid runoff on non-vegetated and frozen ground that leads to a potential significant flooding risk. Add to this any snow melt, and the problem is even further exaggerated. Unfortunately however, many of the events are either under-predicted or not predicted at all in some locations. These occurrences, known for their newsworthiness, generally occur two to three times per year at some point along the White River causing widespread damage and hardship. Further analysis of the issue reveals that the problem is not necessarily determining when precipitation will occur, or even generally where, but more so with when and where any associated flooding will occur as a result. Currently, the National Weather Service (NWS), which is part of the National Oceanic and Atmospheric Administration (NOAA), has the responsibility by law of issuing river forecasts and flood warnings. The NWS, supported by thirteen River Forecast Centers throughout the United States, uses multiple sources of data and other inputs when developing its flood forecasts. Most of this data comes from the office of the United States Geological Survey (USGS). The USGS is the principal source of data on river depth and streamflow and obtains this information from direct gaging of the rivers. At this time there are around 160 streamflow gaging stations in Indiana. Of these, around seventy are along the White River, all recording parameters such as gage height, discharge rate, and water temperature. This is only the first piece of the puzzle however. Determining the existing condition of local rivers may be the easiest piece, since much of it is automated and directly measurable. It is predicting what the future conditions along the river will be is what becomes difficult. 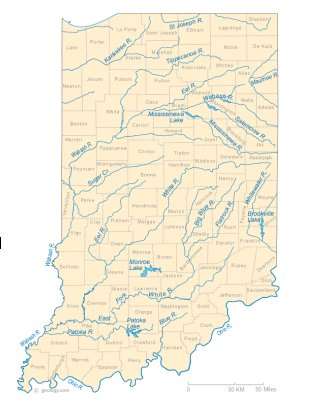 Because much of central Indiana is urbanized and part of the White River watershed and basin, it doesn't take much of a precipitation event to cause problems along the river. In the winter and early spring when the ground is still frozen and lacking moisture-absorbing plant life, there is nowhere for the excess water to go, filling up small streams, creeks, ponds, lakes, and rivers rather quickly. An early spring with a heavy snow pack anywhere within the basin compounds the problem. As the temperature and dew point rise above the freezing point, the snow begins to melt at a rapid pace, thereby raising water levels even further. Areas to the south of the city of Indianapolis are especially prone, since the river flows from north to south. Huge inputs from a severe storm, substantial snowmelt, days of stratiform precipitation, or a combination thereof, can put tremendous strains on the river system and send it all rapidly downstream to low-lying areas. One of the problems discovered associated with determining when and where a flood will occur along the White River is in the process itself. To develop its forecast, the NWS utilizes a complex system of models to determine how the river will respond to a precipitation input. These models are developed for specific forecast points along the river. As heavy rainfall is predicted for the river basin, the forecasted amounts are then added to the model to determine how the river will react in response to the input. In addition, water entering the basin from other tributaries upstream and from any snow melt is also taken into consideration. The river forecast is then produced and updated as needed. However, it is just that, a forecast and like any forecast, a slight change in any of the input data can cause a significant change in the output. What has been happening, as it appears, is that the models used are slow to respond to changes in area watershed characteristics. The central Indiana region has seen explosive growth over the last twenty years or so and therefore has undergone, and continues to undergo, the rapid development of urban areas, drainage improvements, and levee and dam construction. These along with natural changes over the years have dramatically changed the way water flows into and down the river system. Additionally, along with urbanization comes problems associated with it such as blocked or re-directed drainage systems as well as sometimes adverse political implications. Floods continue to be one of the most frequent and most expensive of natural disasters in terms of economic loss and hardship. Not counting droughts, as much as ninety percent of all damage related to natural disasters comes from floods or their associated debris and mud flows. Since we cannot control the weather, we can better prepare ourselves for these catastrophic flooding events by adhering to certain standards as well as learning from previous events. The federal government has already taken a significant step by updating the Federal Flood Maps for the area in 2007. These maps through time have become outdated as progress has changed the topography. According to Ed Ferguson, a local planning director for the area, the Federal Flood maps have not been updated in over ten years. These new maps show much more detail and outline new areas of significant flooding potential. With this new data, the NWS and its River Forecast Offices will need to update their models. With the ability to capture and store data being better than it ever has, the process of recalibrating models should be done more frequently to ensure better accuracy. Additionally, building codes and local ordinances should be amended to reflect these changes as well by not permitting new construction inside newly identified or existing flood plains. This continuous cycle of evaluating and updating data, maps, and models is necessary to limit the amount of damage and loss of life not only along the White River basin, but in all basins across the country. References En-Ching, Hsu, and Rao, Ramachandra. Streamflow Data Analysis. Indiana: Purdue University, 2008. Ferguson, Ed. Personal Interview. 7 March, 2008. Indiana Flood Information Web Page. 08 Feb. 2008. United States Geological Survey. 14 Mar. 2008. http://in.water.usgs.gov/flood_new. Indiana Water Resource Page. 12 Nov. 2006. Indiana Department of Natural Resources. 11 Mar. 2008. http://www.in.gov/dnr/water/water_availability/WaterResource/sflow_analysis.htm Maskey, Shreedhar. Modeling Uncertainty in Flood Forecasting Systems. Delft, Netherlands: Delft University, 2004. National Weather Service - SRH. 27 Jul. 2007. National Oceanic and Atmospheric Association. 14 Mar. 2008. http://www.srh.noaa.gov. Stream Gaging and Flood Forecasting. 20 Sep. 1999. United States Geological Survey. 11 Mar. 2008. http://water.usgs.gov/wid/FS_209-95/mason-weiger.html |