
As one moves south along the Appalachian spine, through the southeastern US, the general thought is that the climate is getting warmer and during the winter time, warmer temperatures would make it much harder to see frozen precipitation. While this may be true with an ordinary synoptic scale setup, on occasion a mesoscale phenomena occurs which totally alters one’s general thinking. This phenomena is known as cold air damming (CAD), aka “the wedge” and most often occurs on the east side of the Appalachian Mountain chain and the east side of the Colorado Rockies. When CAD establishes itself in these areas, a forecaster can be faced with quite a challenge, one that can wreak havoc on forecasting high temperatures and precipitation types. The following paper discusses the various setups of cold air damming, the challenges these setups present to forecasters, and what can be done to better predict the conditions experienced during cold air damming situations, specifically during winter-time setups. CAD setups east of the Rockies and east of the Appalachians are very similar with some differences; however, in this paper emphasis will be placed on Appalachian setups. Cold Air Damming occurs when a low-level cold air mass is topographically trapped on the east side of a mountain range. An area of high pressure at the surface will be positioned to the north of the region and the clockwise flow around the high means the low-level winds coming into the region will have an easterly component. These easterly winds will push up against the east side of the mountain range. Air moving up the mountain range ends up cooling at a greater rate than the dry-adiabatic lapse rate and this causes the upslope flow to slow down allowing the cold air to build up on the eastern slopes. When looking at a surface chart, a CAD setup will often be noted by a distinct “wedging” pattern of cool temperatures trying to push their way down the mountain range spine which can clearly be seen on the East Coast in Fig. 1 below. 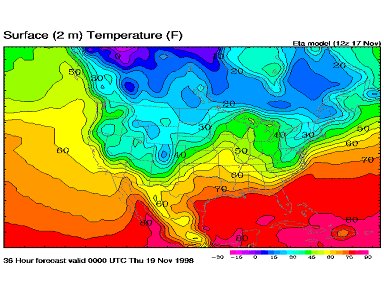 Fig. 1 Surface charts best depict the wedging pattern because warm air will overrun the cold air and warm the upper levels to temperatures above what they are at the surface. This can often lead to an upper level temperature chart looking more like a normal surface temperature chart. If an area of low pressure develops to the south of the region, a blocking situation can occur which causes winds at the low levels to run parallel to the mountains. This process is known as a barrier jet and it can affect the weather by displacing precipitation maxima, enhancing low-level cloudiness, reducing surface temperatures, and increasing precipitation coverage/intensity. If upper level forcing is leading to upward motion, precipitation can form and the characteristics of the cold layer at the surface will ultimately determine what form of precipitation will fall to the ground. For the east facing slopes of the Appalachian chain, CAD events most often occur during the winter months, particularly in December and July while a lesser amount of events will occur during the summer months with a minimum in July. Winter CAD events typically last longer than summer CAD events and are usually much stronger than summer CAD events. There are 3 CAD types which most often affect the east facing slopes of the Appalachians. These are: Classic, In-Situ, and Hybrid. It is important to look at surface charts, 850mb charts, and 500mb charts when trying to determine the specific CAD type for the area. Below, each type of CAD is explained using sample images from the surface, 850mb, and 500mb. A Classic CAD event will occur when surface winds east of the mountain range maintain a northeasterly component rather than easterly as the surface high to the north moves east. The terrain blocking which is occurring is preventing an upslope flow from taking place and while this flow is trying to establish itself, the air starts cooling adiabatically and stratification in the low levels occurs which ultimately hinders the wind shift. An area of low pressure can develop to the west of the mountains and this can enhance the pressure gradient which helps increase cold air advection and strengthen the damming. An onshore flow will also begin to take shape which will allow warm air to rise up over cold air. This overrunning process can lead to significant amounts of precipitation falling through the cold air at the surface. The surface chart below depicts this setup (see Fig. 2). 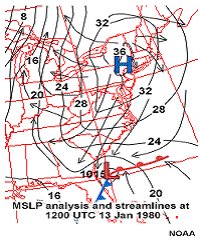 Fig. 2 For a classic setup at the 850mb level (see Fig. 3), we would not find a high over New England, while extensive ridging would take place across the eastern US. This proves there is a shallow layer of cold air at the surface while the southerly flow aloft is creating the overrunning process. 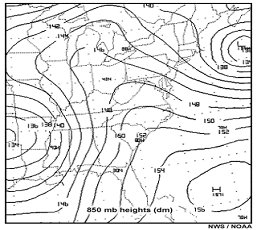 Fig. 3 For a classic setup at the 500mb level (see Fig. 4), often times a deep trough will develop across the central/southern plains which teleconnects to a ridge over the Great Lakes and Mid-Atlantic region. This pattern progresses at a slow rate allowing the cold air at the surface to become better established along with a northeasterly flow east of the Appalachians and a southerly flow aloft providing the overrunning of warm air. 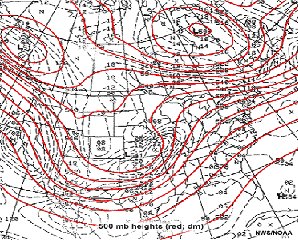 Fig. 4 An In-Situ CAD setup (see Fig. 5) is one in which little or no cold air advection is occurring because the high pressure center which we relied on in the classic setup is too far to the south. Cold air is established through evaporational cooling caused by a pool of dry air east of the Appalachians. Surface winds still tend to be from the northeast along with some mountain-parallel ridging but no cold air advection is occurring from a high to the north. 850mb and 500mb patterns will be very similar to those of a classic setup. 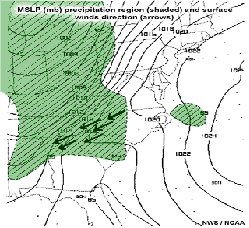 Fig. 5 A Hybrid CAD setup (see Fig. 6) is one in which cold air advection and melting/evaporation work together to establish the cold layer at the surface. With this setup, we can find an area of high pressure at the surface to the north, say over New York State, but it is weak and moving fairly quickly with a north to south orientation. This does not bode well for an easterly flow and so very limited cold air advection takes place. Through a synoptic scale forcing mechanism, precipitation can form over the area experiencing the small amount of cold air advection, and this helps add more cooling to the layer of cold air at the surface. 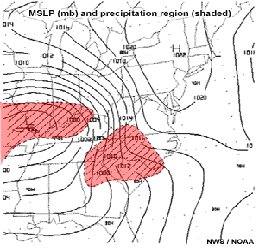 Fig. 6 When attempting to forecast conditions during a CAD event, often times the grid spacing from models will be too coarse to show certain features. Don’t rely on the grid population. Models will typically handle the start of CAD better than its erosion. They handle erosion via a cold frontal passage and a coastal low better than they handle erosion via a surface low passing to the northwest and a surface low moving southwest to northeast through the area. If the model has a surface low passing to the northwest, often times it will bring the warm front too far northwest. If the model is moving the surface low southwest to northeast, it will often try to drive the low straight through the wedge which is a very rare occurrence. Other errors can include: MOS data being premature in warming daytime CAD temperatures back to normal, model QPF being too high in the cold dome during summer CAD, and the ETA increasing solar radiation too much so that the CAD erosion occurs much quicker. The forecast is at stake so picking up on these traits can help the forecaster make a more accurate forecast. Perhaps the easiest way to do this is the monitoring of real time data. Perform hand drawn analysis on surface maps and upper air maps. Check the evolving wind and temperature profiles through soundings. Look at satellite and radar imagery to determine where moisture is headed and how surface and upper level features are moving. Finally, check stability and determine where convergence or divergence boundaries are taking place. Following these simple steps can go a long way in improving the forecast for temperature and precip. type, especially in winter weather situations. References Billet, J. (2006, November 23). Appalachian Cold-Air Damming. Powerpoint lecture presented at Wakefield NWS Forecast Office, Wakefield, VA. COMET/University Corporation for Atmospheric Research. “Cold Air Damming: Causes, Examples,and Forecast Parameters.” 2001. http://www.meted.ucar.edu/mesoprim/cad/webcast/print.htm (April 7, 2007). Iowa Environmental Mesonet/Iowa State University Department of Agronomy. “Week 2 Cold-air damming and Lake-Effect Snow.” February 18, 2002. http://cumulus.geol.iastate.edu/mteor417/wk2.html (April 7, 2007). |