
CAPE stands for Convective Available Potential Energy. It can be thought of as the energy that is available for an updraft in a storm to rise. Generally, as CAPE increases then the storm updraft will increase and a storm will be more likely to have severe characteristics such as large hail, intense lightning and strong winds. CAPE is displayed on a Skew-T diagram. One limitation is that this CAPE value is only for one point location. Forecasters also look at CAPE displayed on a graphical area display to see how CAPE varies across a region. Another dimension can also be added by putting to the image into a time motion to see how CAPE varies over time. The map below shows an example of CAPE contoured over an area. Much of the region has CAPE values of 1,500 Joules/kg or higher. The guide below can be used to get a sense for how significant a CAPE value is when looking at these values: 1 to 1,500: Positive 1,500 to 2,500: Large 2,500+: Very Large 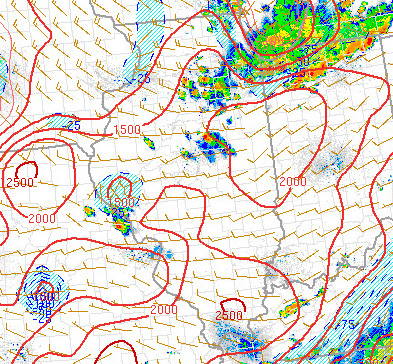 |