
Water vapor imagery is used to analyze the presence and movement of water vapor moisture in the upper and middle levels of the atmosphere. The wavelength spectrum used to detect water vapor is in the 6.7 to 7.3 micrometer wavelength range. The upper and middle levels of the atmosphere are from about 650 mb to the top of the troposphere. Above the troposphere there is very little moisture. Why doesn't water vapor imagery detect moisture in the lower atmosphere and near the surface? Only the top most level of moisture is detected using these wavelengths. For example, think about clouds on visible imagery. If there is a thick layer of clouds in the upper levels then you will not be able to see the clouds that are closer to the surface. The same applies to water vapor. When upper level moisture is present, this layer of moisture will prevent the detection of water vapor that is below this layer. If the upper levels are dry then water vapor can be detected in the middle layers of the atmosphere. There is usually though enough moisture in the middle and upper levels that moisture in the lower levels is not detected. Water vapor absorbs radiation in the wavelength from 6.7 to 7.3 microns. Suppose there is a thick layer of moisture in the upper levels. This layer of moisture will absorb the IR radiation in the 6.7 to 7.3 micron wavelengths that are being emitted from the lower troposphere up to this layer. Thus, the satellite receives less radiation in the 6.7 to 7.3 micron spectrum where there is a higher concentration of upper level moisture. The satellite will interpret this greater absorption as a colder temperature and a higher concentration of water vapor. If the upper levels are dry then less radiation is absorbed by moisture in the 6.7 to 7.3 micron spectrum in the upper levels. The satellite will interpret this lesser absorption as a warmer temperature and a lesser concentration of moisture. A high emission in the 6.7 to 7.3 micron spectrum indicates the emission is coming closer to the lower levels of the troposphere where it is warmer and more moisture is present. A dark color or warm color indicates a relative lack of upper level moisture. It does not mean though there is a lack of moisture in the lower levels or at the surface. It could be very moist at the surface or it could be fairly dry. A white or cold color indicates a high concentration of water vapor. This layer of water vapor is absorbing radiation in the 6.7 to 7.3 micron range. Below is an example water vapor image that is colorized. The red and orange colors (warmer areas) indicate there is a relative lack of upper and middle level water vapor. Less radiation is being absorbed by water vapor thus the satellite is detecting warmer levels of the atmosphere. Air can be relatively dry by either dry air advecting (moving) over an area or the drying of air by it sinking. When air is sinking it is going to force moisture to stay closer to the surface and not convect or move up into the upper troposphere. The purple, blue and green areas indicates an abundance of upper level moisture. This is moisture advecting or vertically rising into the upper troposphere. This layer of moisture will be cold since temperature in the upper troposphere are very cold. Although the air is very cold, it is saturated or near saturation and thus has much more moisture than it would if the air was sinking. Clouds will show as bright white or colored with cold temperatures and upper level clouds will be very cold. Water vapor can be detected without the presence of clouds. Clouds are moisture in the liquid or solid state of moisture. Water vapor is gaseous water. Water vapor tends to look more wispy on water vapor imagery while the clouds look more solid. 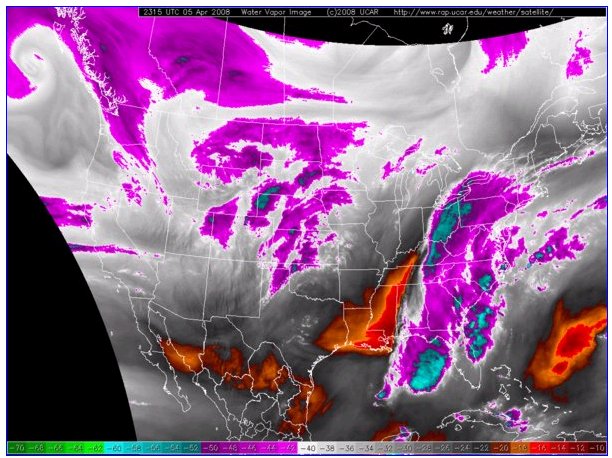 Below are some uses of water vapor imagery. 1. Water vapor imagery can be used to detect dry slots. Within the dry slot precipitation intensity diminishes and precipitation chance is reduced. Dry slots can happen when a mid-latitude cyclone or tropical system advects air from a dry air source into its circulation. 2. Water vapor imagery can be used to detect moisture advecting in from the tropics. This moisture laden air can produce big precipitation events when it is advected into a storm system. 3. Dry air in the middle and upper atmosphere indicates there are no significant upper level dynamics aloft that will cause the air to rise over those areas. Very moist air aloft though indicates there could be significant dynamic lifting the air such as jet stream divergence and positive vorticity advection. 4. Water vapor imagery allows the forecaster to see a complete atmospheric motion that is not just where the clouds are. This circulation can be used to point out troughs and ridges and where vertical motions are rising and sinking. 5. Water vapor imagery can be used to pick out the exact position of upper level lows. |