
The San Fernando Valley is an urban valley in Southern California, located in the northern region of the Los Angeles metropolitan area. The topography of the San Fernando Valley, distilled to it’s simplest form, is a large bowl surrounded by the Santa Susana Mountains (Northwest), San Gabriel (Northeast), the Verdugo Mountains (East), Santa Monica Mountains (South), and Simi Hills (West). Figure 1 illustrates the areas topography while Figure 2 illustrates the dense population.1, 2 The San Fernando Valley has a dry climate and a dense population of approximately 1,808,599 people in an area of 345 square miles.3 Considering the topography of this bowl-like and densely populated dry climate region, it’s not surprising that the threat of heavy rainfall presents difficult challenges. A microclimate is the distinctive climate of a small-scale area. The urban density and volume of buildings in the San Fernando Valley (SFV) denote the microclimate of the SFV to be that of a “heat island”. Urban microclimates considered “heat islands” are typically prone to more rainfall than their surrounding non-urbanized areas. To put it simply, the buildings and concrete retain heat thus promoting warm rising air. (See Figure 3: Urban Heat Island Effect) A 2002 NASA study regarding heat island affects affirmed what forecasters have theorized for years, “Rising warm air may help produce clouds that result in more rainfall around urban areas.” This study also noted, “Researchers have for the first time used a rainfall-measuring satellite to confirm that "urban heat-islands" create more summer rain over and downwind of major cities.” 4 In a recent study examining the SFV atmospheric rainfall setup, researchers stated, “Synoptic and meso-scale climatic influences undoubtedly affect, directly or indirectly, the Valley’s temperatures, but it seems that micro-scale influences are apparent contributors to the potential urban heat island. Buildings, paved streets, parking lots, and freeways promote a heat island effect by nature of their composition, however, it appears topography and motor vehicle emissions are most influential instigators of the Valley’s heating trend since the early half of the 20th century.” 5 Undoubtedly, the growing heating trend of the SFV raises alarming questions about the potential of increasing rainfall. The consequences of past record rainfall events have been catastrophic. The primary affect of heavy rainfall in the SFV is severe flooding and flash flooding. Twenty-one deaths and millions of dollars in property damage were reported during a torrential rain in 1962. Thousands were evacuated and eight people died during the January 1952 flood, where more than a few inches of rain fell within 24 hours. Floods in 1995 left eleven dead and $300 million in damages statewide. During the winter season of 1998, floods caused $475 million in damages statewide. 6 Dams supporting the SFV area include The Los Angeles Dam and Reservoir, Hansen Dam, Sepulveda Dam, San Fernando Valley Dam, and Baldwin Dam. Although dams have been built for flood control, more measures are needed to insure safety. On December 14, 1963, a 50-ft wall of water from the Baldwin Hills Dam plowed into the valley below, killing five people and causing $50 million in damage. The San Fernando Valley Dam nearly failed in 1971 during an earthquake when the shaking caused a slide of the top thirty feet and led to the evacuation of eight thousand people residing downstream of the dam. 7 A common creed among weather forecasters is to communicate with the goal of saving lives and property. It’s evident that flooding significantly threatens the safety of lives and property. Hence, the obvious question is posed, “How can SFV city-planning officials and news media better serve the community during the threat of a heavy rainfall event?” The response includes expert opinions as well as personal opinion (as a former Southern California resident). Recently, the Los Angeles County Economic Development Corporation released a research study involving a redevelopment assessment on the SFV. Research suggested that the high volume of traffic has eroded the quality of numerous streets in the SFV. Experts concluded that SFV infrastructure needs better street maintenance, more curb gutters more storm drains. Thus, city-planning officials can better serve the community by designing and executing installation of these water management tools in projected infrastructure projects. 8 As witness to various broadcasts during flooding events, I recommend that news producers execute “running crawls” more frequently, particularly during non-news programming. Also, more time should be allocated for weather segments. While the weather is usually the lead story during heavy rainfall events, instead of just starting out the broadcasts with the weather, an extra few minutes should be given for on-location footage near damns and vulnerable areas. Forecasters should also include past flooding footage within their weather segments to give viewers a visual reminder of the threat. A reminder to the viewers of current measures in place to impede flash flooding would also be helpful. Research suggesting the increasing temperature trend of the SFV is helpful for forecasting heavy rain events. However, that’s just half the battle. Research suggests that restructuring of the SFV infrastructure is necessary to help thwart future flooding. Also, research further suggests that, considering the topography of the “heat island” microclimate of the SFV and the increasing temperature heating trend, the threat of heavy rainfall continues. Reference Page Figure 1. http://en.wikipedia.org/wiki/San_Fernando_Valley, 4/9/2007 Figure 2. http://130.166.124.2/world_atlas/1/files/1-1141-full.jpg, 4/9/2007 http://library.csun.edu/mfinley/valley.html, 4/5/2007 Figure 3, http://www.gsfc.nasa.gov/topstory/20020613urbanrain.html http://www.piercecollege.edu/offices/weather/sfv_summary.html, 4/10/2007 http://www.latimes.com/news/, 4/8/2007 http://www.abag.ca.gov/bayarea/eqmaps/damfailure/dfguide.html, 4/4/2007 http://www.valleyofthestars.net/Library/NESFV_EDAC/NESFV_Report.pdf, 4/9/2007 Figures 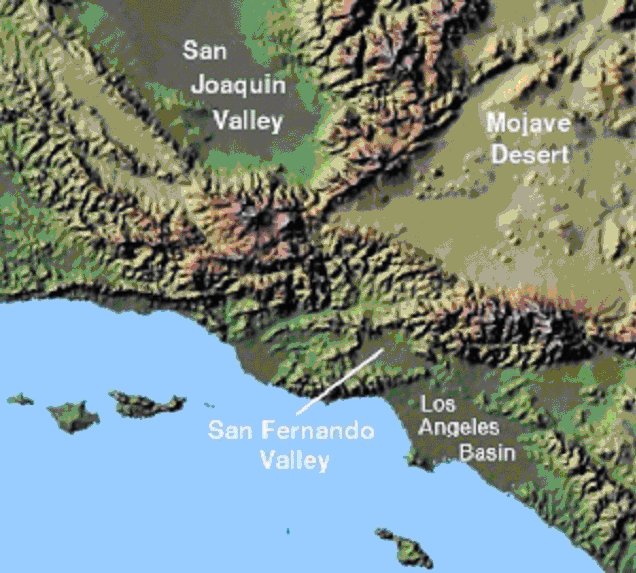 Figure 1: SFV Topography 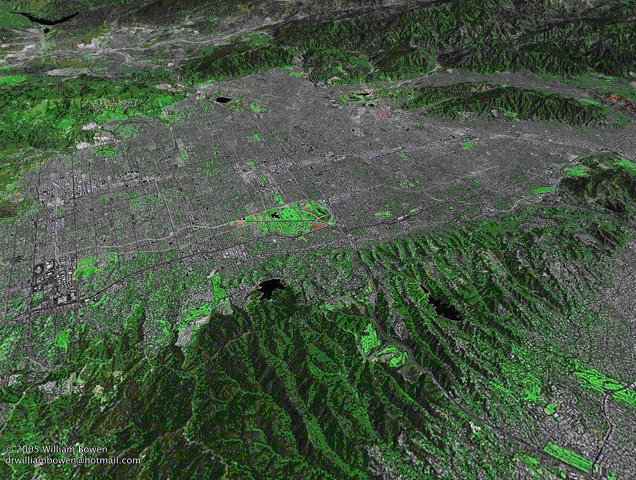 Figure 2: SFV Urban Density 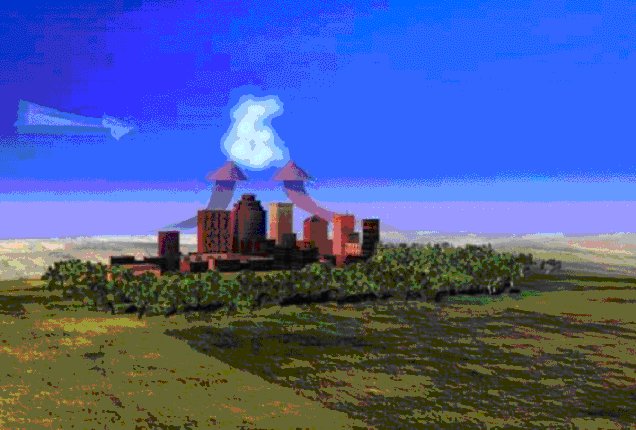 Figure 3: Urban Heat Island Photo Courtesy of NASA, 2002 (Ref. 8) |