
GRAPHICAL AREA DISPLAY:
RH BETWEEN LCL and LFC
| |||||||||||||||||||||||||||||||||||||||||||||||||||||||||||||||||||||||||||||||||||||||||||||||||||||||||||||||||||||||||||||||||||||||||||||||||||||||||||||||||||||||||||||||||||||||||||||||||||||||||||||||||||||||||||||||||||||||||||||||||||||||||||||||||||||||||||||||||||||||||||||||||||||||||||||||||||||||||||||||||||||||||||||||||||||||||||||||||||||||||||||||||||||||||||||||||||||||||||||||||||||||||||||||||||||||||||||||||||||||||||||||||||||||||||||||||||||||||||||||||||||||||||||||||||||||||||||||||||||||||||||||||||||||||||||||||||||||||||||||||||||||||||||||||||||||||||||||||||||||||||||||||||||||||||||||||||||||||||||||||||||||||
METEOROLOGIST JEFF HABY
When CAPE is present from the potential for surface based convection, the sounding profile will have both a LCL and a LFC. The LCL is the Lifting
Condensation level. This is the height that a parcel first becomes saturated when force lifted from the lower PBL. The LFC is the Level of
Free Convection. This marks the bottom of where the region of CAPE and instability first begins. The LFC will be at or above the LCL in
elevation. The vertical distance between the LCL and the LFC will vary. The relative humidity between these two levels will also vary. Instability,
thunderstorms and severe storms will have a greater magnitude or threat when the LCL and LFC are relatively close together and the relative
humidity between these levels is relatively high. The reasons for this can include: CAPE starting closer to the surface, less entrainment
of dry air into the updraft as it is force lifted from the LCL to the LFC, and better overlap between instability and wind shear in the lower
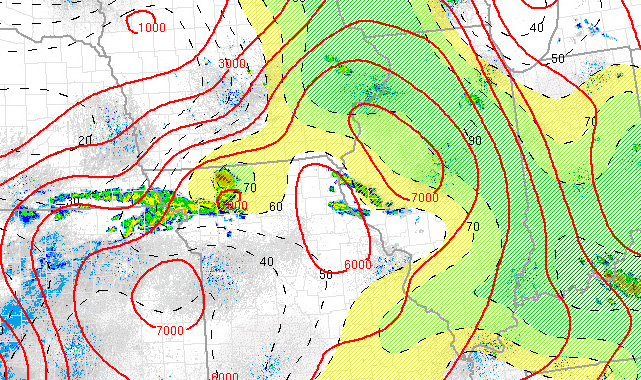
troposphere given the presence of significant low level wind shear. The image below shows as example of an area display of relative humidity
between the LCL and LFC in the black dashed lines. Values above 70% are relatively high while values below 60% are relatively low. If
no other limiting factors are present, high LCL to LFC RH values will enhance instability and storm strength.
|
|
|