
Mean layer CAPE (ML CAPE) is not CAPE that is out to hurt anyone�s feelings. This form of the word �mean� comes from statistics which is a synonym for finding the average. Thus, mean layer CAPE is an average that is used to determine the starting parameters for a rising parcel of air. Since it allows for a more realistic value of the initial conditions for a rising parcel of air�s temperature and dewpoint, it is generally superior to using the ground surface temperature and dewpoint. The mean layer CAPE assesses the layer of air from the surface to 100 mb above the surface. For example, when the surface pressure is 1000 mb, the layer of air that will be assessed is from 1000 to 900 mb. Two averages are found within this layer which are the average temperature and the average dewpoint. As mentioned in the previous mini lecture on MU CAPE, using an average temperature and dewpoint in the lowest 100 mbs is a more realistic approach since there is significant mixing of air in the boundary layer and the parcel that is being lifted is a large volume of air that can take up a significant depth of the boundary layer. Also, the dewpoint and temperature values right at the surface tend to be contaminated by physical processes that are not adiabatic. The diagram below shows a pedagogical example of finding the average temperature and dewpoint in the lowest 100 mb, and then using those values to lift the parcel to the LCL (Lifting Condensation Level) and then wet adiabatically above the LCL. The dashed straight slanted lines passing through the pressure level that is 50 mb above the surface is a good starting place for plotting the average temperature and average dewpoint values. Since the temperature profile is increasing with height, the average temperature is warmer than the surface temperature and since the dewpoint decreases with height, the average dewpoint is lower than the surface dewpoint. Where the dashed straight lines from the surface cross the dewpoint profile and where it crosses the temperature profile is around 50 mb above the surface and the point where these intersections meet is what is being used for the starting value of temperature and dewpoint. The parcel first lifts dry adiabatically to the LCL which is where the parcel first becomes saturated which is a little above the line drawn for 100 mb above the surface. The region where this parcel is warmer (to the right of) the temperature sounding is where the region of CAPE will be located on a Skew-T Log-P diagram (hatched area on diagram below). The mean layer CAPE can give a more realistic value of the CAPE that will be actualized in a situation that surface based (boundary layer) convection occurs. 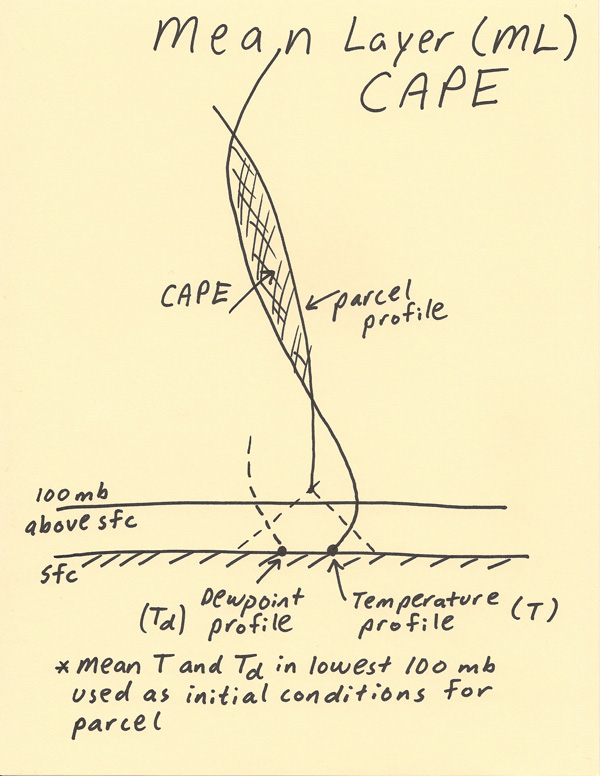 |