
| HABYTIME MINI LECTURE 44: THE HODOGRAPH
| |||||||||||||||||||||||||||||||||||||||||||||||||||||||||||||||||||||||||||||||||||||||||||||||||||||||||||||||||||||||||||||||||||||||||||||||||||||||||||||||||||||||||||||||||||||||||||||||||||||||||||||||||||||||||||||||||||||||||||||||||||||||||||||||||||||||||||||||||||||||||||||||||||||||||||||||||||||||||||||||||||||||||||||||||||||||||||||||||||||||||||||||||||||||||||||||||||||||||||||||||||||||||||||||||||||||||||||||||||||||||||||||||||||||||||||||||||||||||||||||||||||||||||||||||||||||||||||||||||||||||||||||||||||||||||||||||||||||||||||||||||||||||||||||||||||||||||||||||||||||||||||||||||||||||||||||||||||||||||||||||||||||||
METEOROLOGIST JEFF HABY
The hodograph is used to assess the vertical wind profile of a location. The graph shows how the wind speed and direction changes with height.
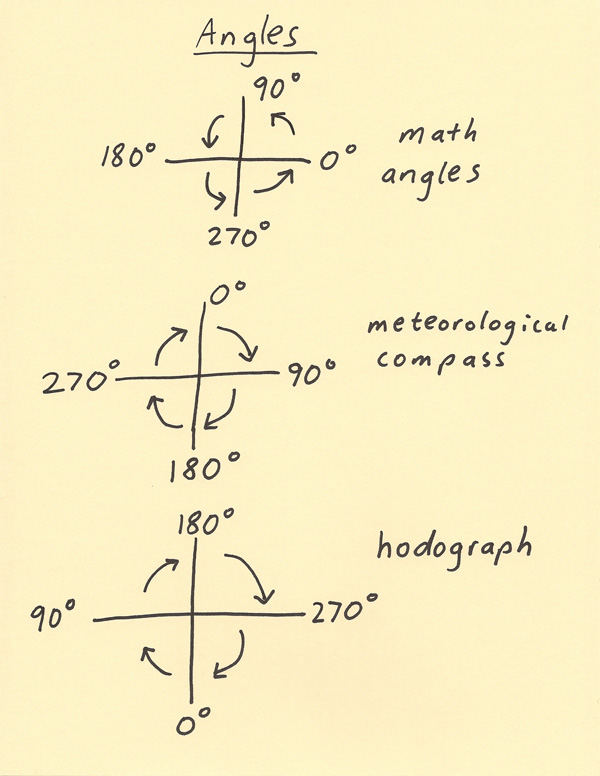
One of the more interesting features of the graph is how the direction coordinates are labeled. To start, they will be compared to other
coordinate systems. Typically the most familiar system to math and science students is the one that is used in math courses such as
algebra and calculus. This system is shown below as “math angles”. In this system 0 degrees starts to the right and on the x axis.
The angles move counterclockwise around the graph produce the 360 degrees in a complete circle. The next system that will be looked
at is called the “meteorological compass”. In meteorology, the top of the y axis is where 0 degrees starts and the degrees move
clockwise around the graph to produce the 360 degrees in a circle. Finally, we can get the hodograph degree system by flipping
the meteorological compass both top to bottom and right to left. This produces the hodograph where 0 degrees is along the bottom
of the y axis and the degrees move clockwise around the graph producing the 360 degrees in a circle. The hodograph uses this
variation of the meteorological compass since the graph produced will show the speed and direction at which the wind vectors
drawn from the center of the graph will interact with a storm. For example, a wind from the southeast will also have a wind
vector pointing from the southeast. After the image below, an example hodograph plot will be discussed.
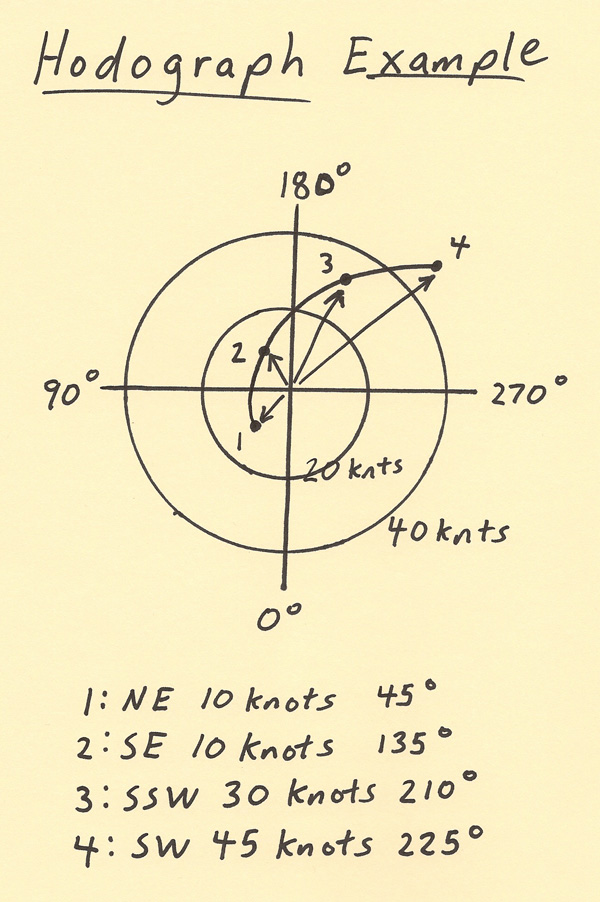
The sketch below shows an example of a hodograph. The concentric circles are “speed rings”. The center represents 0 knot wind speed
and in this particular example each ring represents an increase of 20 knots to the wind speed. The 360 degree compass is drawn
with 0 at the bottom, 90 degrees to the left, 180 degrees at the top and 270 degrees to the right. An example wind speed and direction
plot is given on the diagram. Point 1 represents a wind from the NE at 10 knots. Notice the wind vector drawn from the center
to Point 1. Point 2 represents a SE wind at 10 knots. Notice that point 3 is a greater distance from the center since the
wind speed is higher and at point 4 the wind speed is even higher. The points are then connected by a smooth curve. This
smooth curve is the hodograph display and it can be used to assess how significant the wind speed shear and directional
shear is. Wind vectors in this example are drawn from the center to each point to show how the wind field would interact
with a storm if a storm was present. In this example, the wind is veering significantly with height. In other words the
wind is turning clockwise with height going from Point 1 to Point 4. There is also some speed shear since the wind speed
is increasing with height.
|
|
|