
The primary information to gain from station plots is temperature, dewpoint (or dewpoint depression), pressure (or height), height change, wind direction, wind speed, visibility, and weather. * Surface temperatures are given in degrees Fahrenheit. Upper air observation temperatures are given in degrees Celsius. * Surface dewpoints are given in degrees Fahrenheit. Upper air observation dewpoint temperatures are calculated using degrees Celsius. * Surface pressure is given in millibars. Either a 9 or a 10 is added to the beginning of the observation (e.g. 027 is 1002.7 mb, 999 is 999.9 mb). Whichever value is closest to 1000 mb determines if a 10 is placed in front or a 9. * Dewpoint depression is placed on upper air charts but not at the surface. The dewpoint depression is the temperature difference between the temperature and the dewpoint (e.g. If the temperature is 5 ° C and the dewpoint is -2 ° C, the dewpoint depression is 7. Dewpoint depression is always expressed as a positive number. If the dewpoint depression is less than or equal to 5, the open circle of the station observation is blackened in. * Pressure is given on surface observations while height is given on upper air observations. Below are the mandatory pressure levels and their average height in the atmosphere. The method to find the geopotential height on an upper air chart is also given. 850 mb …. 1,500 meters (the first digit is a 1 and is omitted, e.g. 478 is 1,478 gpm) 700 mb …. 3,100 meters (the first digit is a 2 or 3 and is omitted) 500 mb …. 5,500 meters (the last digit is a 0 and is omitted, e.g. 540 is 5,400 gpm) 300 mb …. 9,300 meters (the last digit is a 0 and is omitted) Upper air observations will leave off the first digit at 850 and 700 millibars. At 500 and 300 millibars the last 0 is left off. You must put a number in front of the observation that makes it the closest to the average height (e.g. 057 at 700 mb would be 3,057 meters while 493 would be 1,493 meters on an 850 mb chart; 2,057 meters would be unrealistically too low on a 700 mb chart, therefore a 3 is chosen instead of a 2). * Height change is displayed on upper air charts. This is the distance in meters from the previous height (e.g. if 12 hours ago the 700 millibar height was 3,100 meters and it is now 3,040 meters, the height change will be given as -06. Add a 0 to height change for actual value in meters. Troughs develop toward greatest height falls. * A wind staff pointing in the direction from which the winds are coming from shows wind direction. A North wind is from 360 ° or 0 °, and East wind is from 90 °, a South wind is from 180 °, and a West wind is from 270 °. * Lines perpendicular to the wind staff indicate 10 knots while half lines represent a 5 knot wind. A half line at a 45 ° angle to the wind staff indicates a wind less than 5 knots. Triangles are used for 50 knots. The summation of the lines and triangles yield the wind speed. * Visibility is shown on surface charts usually to the nearest 1/4 mile. If weather is occurring such as rain, snow or fog, the visibility is plotted next to the current weather if a visibility value is given. * The station plot is shaded on a surface plot depending on extent of cloudiness. Cloudy skies are shaded in fully, broken skies are shaded by 3/4th, partly cloudy/sunny is shaded half and mostly sunny is shaded by 1/4th. The following examples include a surface observation and the interpretation as well as an upper air plot and interpretation. On the following pages are a surface map of the US followed by an upper air chart. Examples of surface and upper air decoding are given below. 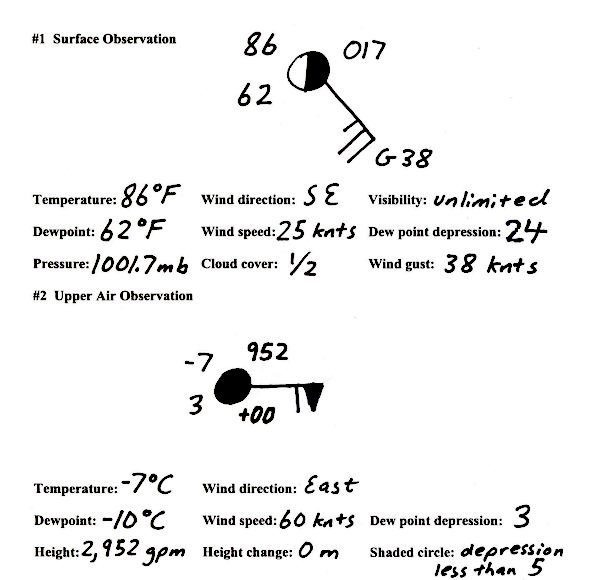 The meteorological compass The meteorological compass uses 360° of angular distance with 0° being a wind from the north, 90° being a wind from the east, 180° being a wind from the south, and 270° being a wind from the west. If wind direction is given in degrees, round this value to the closest cardinal direction given on the compass below. 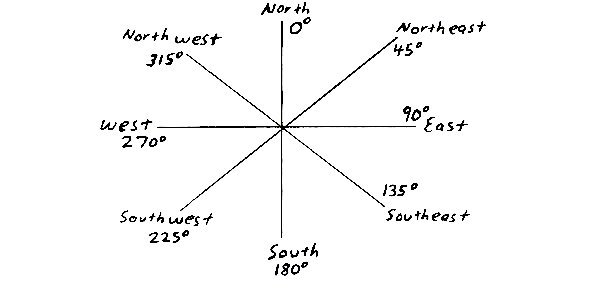 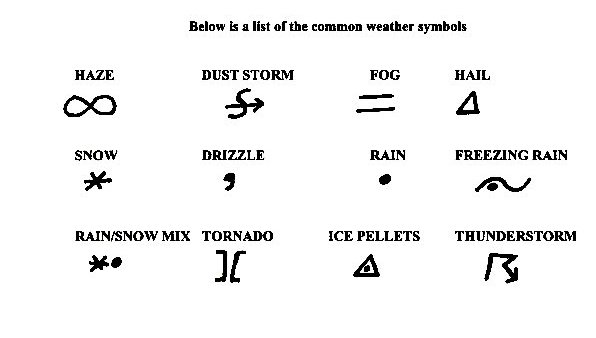
|