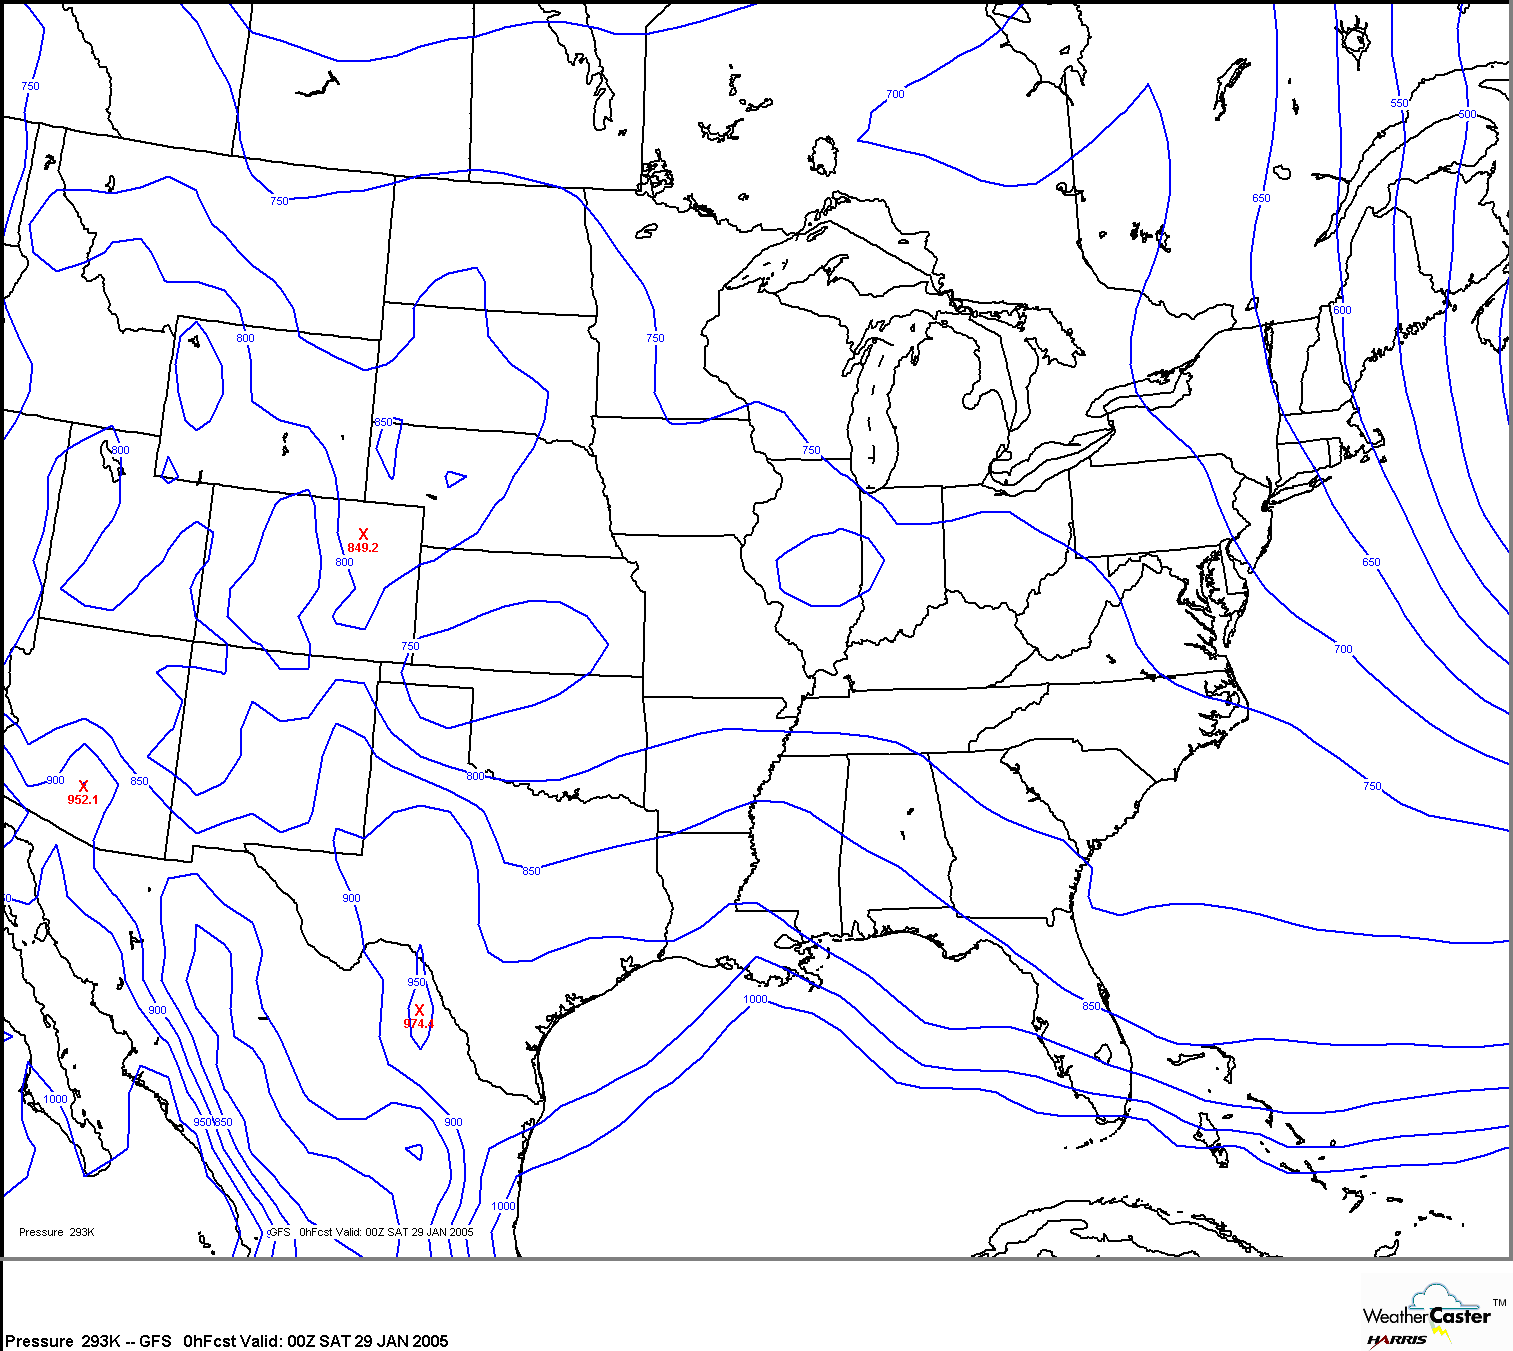
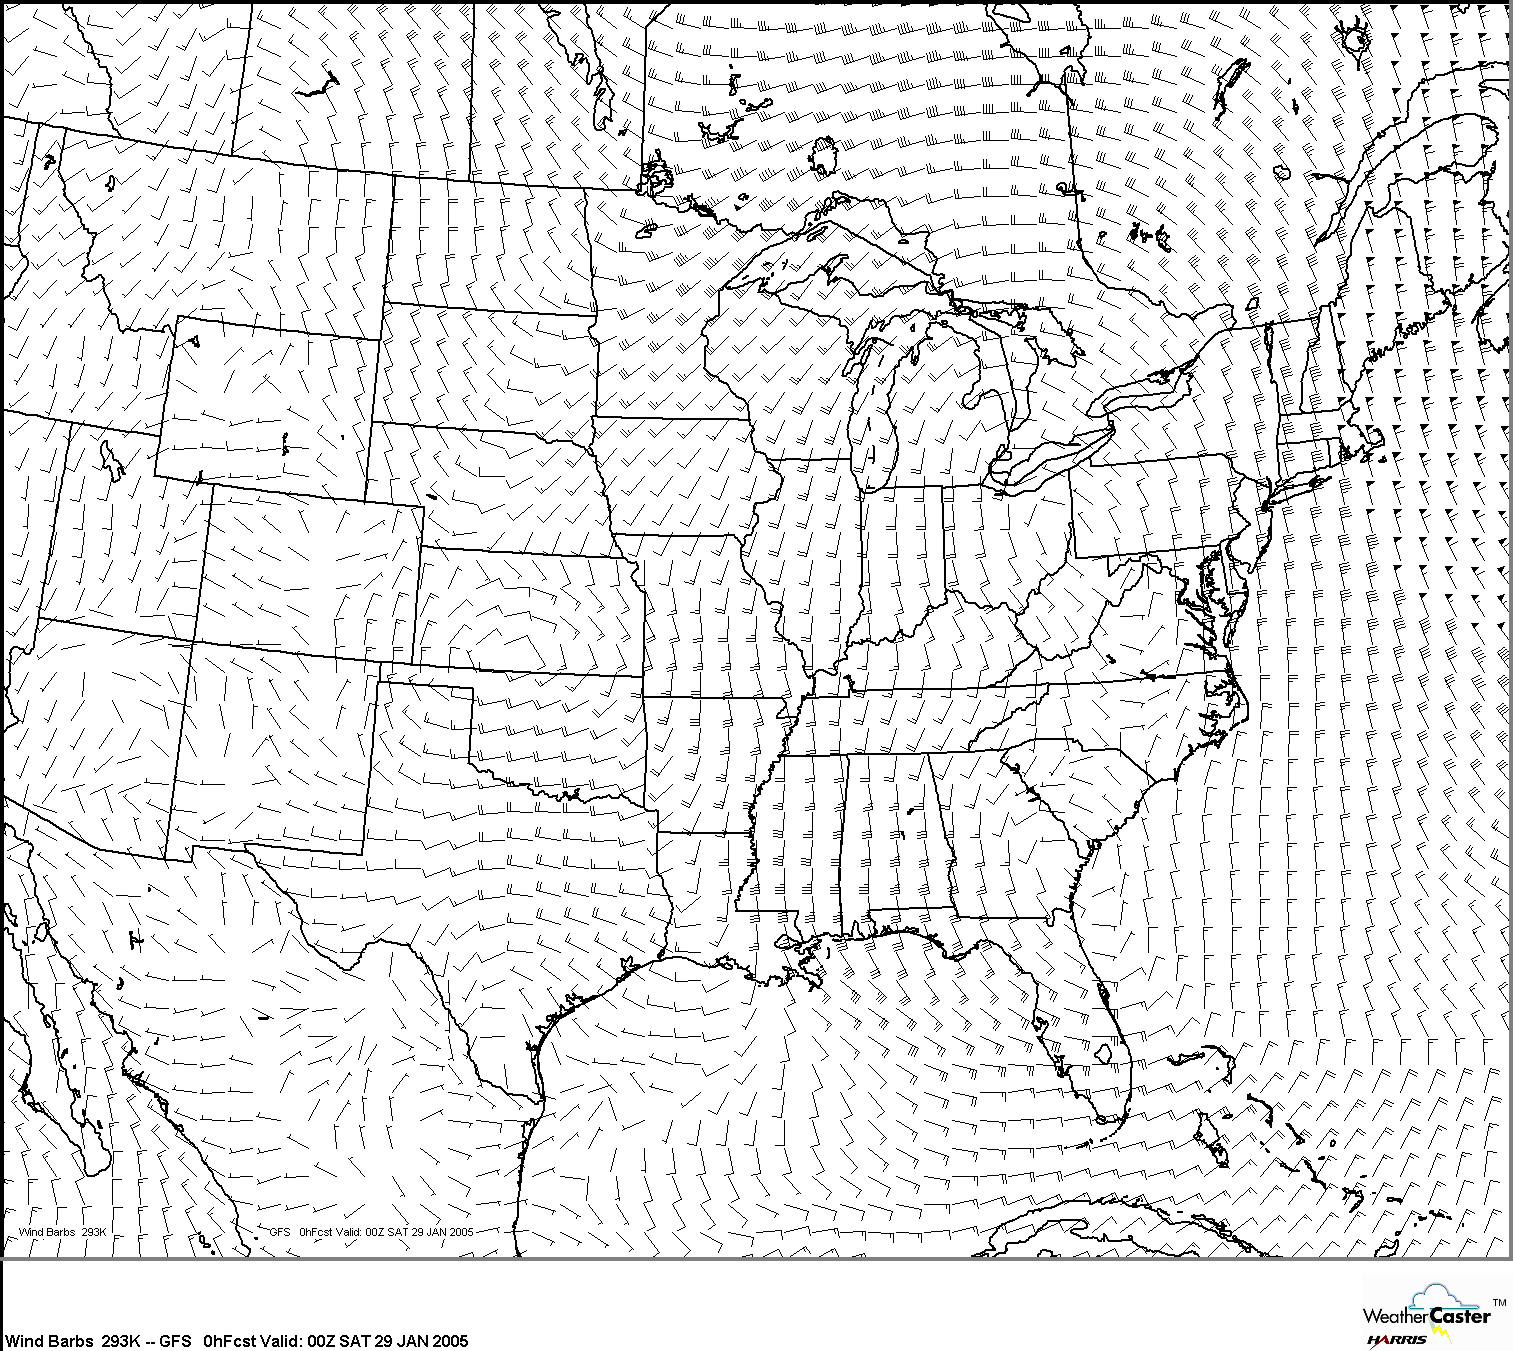
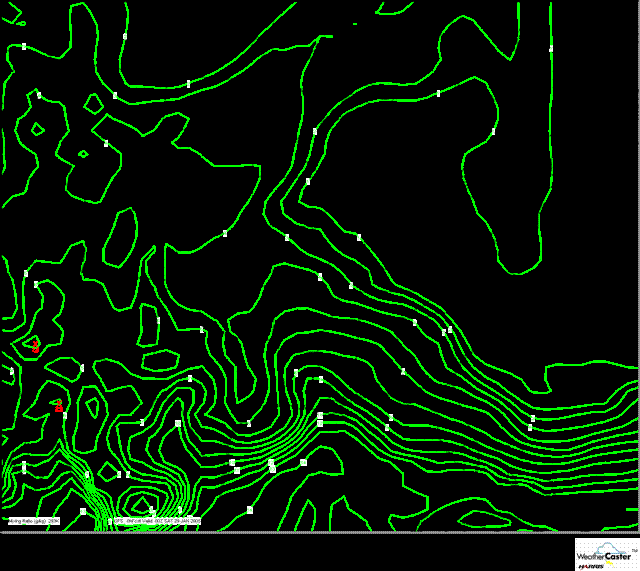
January 29, 2005 Saturday morning 615 AM CST Author's website: http://www.home.earthlink.net/~pvamagic/bigwx4bigeasy/ *** Concepts on Isentropic Lift that lead to rain and thunderstorms *** Before you say, "Oh no! Not another looong forecast writing by T. Scott", allow me to step in and say that this is not just another long writing on some upcoming forecast event. That's because we'll take an in-depth look into yesterday's event on one particular topic, and I've included 3 graphics maps (given at bottom of this webpage) to support this, with emphasis on the focal point of isentropic lift. This will be a deviation from my regular norm of forecast writings, in which I'll attempt to provide you with some conceptual explanations as to WHY and HOW this rain event yesterday on Friday, January 28, unfolded as it did, but with much more scientific detail, than I had time for in the preceding days. For graphical illustration output, I have included 3 large oversized pictures with this writing for you to inspect, at the bottom, and view as I hope this will help to visualize that which I attempt to explain down below. This writing and explanation goes FAR more beyond than that which you can just get from some ordinary NWS writing, so here it goes: Now first..... I. (What IS isentropic lift?) (And what are the sensible effects and impacts it has on MY life?) Typically, you hear folks on TV or in the NWS refer to isentropic lift or isentropic upglide simply as the word, "overrunning" in that it is an event defined as relatively warmer, moister air that rides up and over a thin, relatively cooler, drier shallow layer at the surface over a particular region. Such air that is forced to rise upwards when it is moist or when it becomes moist, forces the air to cool and condense into clouds and then water droplets which finally fall as rain, if the isentropic lift is strong enough to bring this about. Simply put, isentropic lift, is an occurrence in the lower troposphere that can ignite an area of rain and/or thunderstorms to develop and maintain such an area of rain for hours on end, given the right atmospheric conditions are conditionally in the right place at the right time and are in-synchronization with ingredients needed. More technically, isentropic forecasting works on the assumption that a given volume of air, (or parcel), does NOT move in a pure horizontal motion, but INSTEAD it WANTS to cling-on to its OWN potential temperature, called "theta" in mathematical terms. Since the air 'wants' to cling-on or attach itself to its OWN potential temperature, then this requires it to travel UPWARD or DOWNWARD to achieve this, which creates a trajectory slope or angled trajectory upward or downward that the air must travel in order to cling on to its own potential temperature. This assumption or theory works so's long as there's no exchange of heat, evaporation, or condensation. So on this idea, then, upward vertical motions can be a little bit better assessed or derived according to the SLOPE or increase in angle that the air moves up with respect to the direction and speed of the winds, that propel such air, and the amount of water vapor present. Obviously the stronger the winds, the more it will be forced upward this slope and the steeper the angle and more moist the air is, the more potential there is to create a very heavy rain and thunderstorm event, if the winds are strong enough, and from the correct direction, to propel the air upward such a steep angled slope to precipitate the moisture out. Once a person grasps this concept, it becomes much easier to understand this precipitation process and how it works. It's actually quite interesting. I discuss it here, ONLY because it was something that just occurred yesterday on Friday, January 28 over Southeast Louisiana, and I have a few maps to share with you on this. II. (What forecasting maps do you look at for this?) For the past 4 years that I have been writing my own forecast writings, I have only recently just begun finding a few FORECAST maps on this topic of isentropic ascent, as they are rare to find. These forecast maps are NOT a crystal ball that contain 'magical' answers, but instead, they rather OFFER some better insight into a graphical output viewing of geographical locations on where isentropic processes are forecast to take place. Think of it as merely a tool that helps a forecaster do his job. The 3 main ingredients I have very recently begun reviewing, since I just obtained these reference maps are these 3 elements on forecast maps: 1.) Elevation pressure levels; (Various heights above the ground that are in blue solid lines pictured below) 2.) Mixing Ratios (Think of this as a measure of water vapor content in the air; i.e. dry vs. moist. These lines appear in green on the attached file picture I included that has the paperclip icon that you have to open) 3.) Direction and Speed of Winds, (As shown in wind barbs in the picture included below) The following website overlays these three products on an analysis chart. The following is a guideline for which isentropic value to use as a function of season: Winter: 280 K - 294 K Spring / Fall: 295 K - 305 K Summer: 306 K - 315 K http://weather.cod.edu/analysis/analysis.isentropic.html III. (How do you interpret these maps??) What I'm interested in seeing is WHERE and at WHAT TIME are the gradients of these 3 elements the TIGHTEST gradients and coincide with one another in a favorable position?? I want to see that the direction of the wind is angled from such a direction that transports the higher mixing ratio numbered lines over and into an area that initially has lower values. Usually this wind direction is from a southerly direction, varying southeast to southwest, typically at fast speeds of 20 kts or, better yet, even greater than that. I prefer to see that the winds are perpendicular to these mixing ratio green lines, for best advection or transport efficiency, and not parallel to these lines. I also like to see a tight gradient of the elevation pressure levels. (Why?) Because this indicates a VERY STEEP SLOPE that the volume of air needs to go up to produce a more robust, intense rain or thunderstorm event. But the caveat to this is it requires a strong wind perpendicularly to this pressure slope, for which the direction of the wind points toward higher elevations, along with a good, strong moisture flux gradient as well. Look at the blue lines in the picture appearing below for instance. Can you see how one of the blue lines is nearly intersecting in the vicinity of Grand Isle, Louisiana, or between Grand Isle and Larose? That is where the GFS assessed that the height of the 950 mb level was that corresponded to the 293 Kelvin potential temperature. Neat, right? You use higher potential temperatures in the warm season and lower potential temperatures in the cold season. 950 mb, for this example translates to a height of 1,936 ft above the ground. Now....look at the next blue line north of the one near Grand Isle. The NEXT blue line which cuts through the border of St. Tammany Parish and Washington Parish of Southeast Louisiana is the 900 mb line. This translates to a height of 3,435 ft above ground level. So if this parcel or volume of air wants to cling-on to its own potential temperature (the 293 Kelvin), then it must go up and RISE in elevation from 1,936 ft from near Grand Isle, UP to an altitude of 3,435 ft up near the Washington/St. Tammany parish boder, WHEN THE WIND IS BLOWING FROM THE SOUTH, for which it just about is on the wind chart beneath the other chart appearing below. So this parcel of air must RISE upward and, as the attached mixing ratio line graphic shows, this is also showing whereby higher values of water vapor (or mixing ratios) are being transported northward from Grand Isle toward the northshore parishes, while at the same time the air is rising upward to cling-on to that 293 Kelvin potential temperature. Put all this together and you have relatively moister air getting transported northward, WHILE IT IS being forced to go up. In the most basic, watered-down sense, wet air going upward leads to clouds which can then lead to rain if the many conditions are met such as if the slope is steep enough, the wind speed is strong enough, the wind direction is correct, and there is enough moisture present to be precipitated out. Many times this isn't always is the case!! If I seen only 3 to 4 g/kg of mixing ratio heading up my way instead of 10-12 g/kg, then I wouldn't go holding my breath hoping or waiting for that much, if any, rain to occur, because moisture content is lacking, even though the slope may be steep enough or the winds strong enough. It's a very conditional-dependant process, this isentropic lift. There are so many ways for it NOT to materialize. Let's suppose the winds, instead, came from a northwesterly direction, across Southeast Louisiana, while keeping the same orientation of pressure lines and mixing ratio lines. Then what happens over Southeast Louisiana in the pictures below? NO action; nothing happens. The pressure slope would be steady-state and not be rising. Remember you need rising ascent for clouds and precipitation. Also there would be no transport of higher moisture into the region. It too, would be steady-state. (Small potatoes; no great shakes; and storm lovers go home disappointed, with suicidal tendencies). Take the reverse now. What if the wind direction at the 293 K potential temperature level was from the northeast with that very same configuration on mixing ratios and elevation pressure surfaces for the 293 K potential temperature staying as they are right now? A wind direction from the northeast at that potential temperature would mean air would be flowing DOWNWARD the slope of elevation and lower values of mixing ratios will spill in and invade the region meaning lower moisture and sinking air. Well, lower moisture and sinking air would have meant A LOT MORE HAPPY FACES for last night's parades, as there'd have been NO RAIN at all!! But that wasn't the case as you can see from the 3 graphics I included, with the 3 below including mixing ratios as the green lines. All 3 of these elements actually appeared as being overlaid on top of each other in its original composition, but couldn't get it to translate into this writing properly. What these forecast maps do not provide is a QUANTITATIVE ASSESMENT in terms of exactly WHERE and WHEN, precisely, the rain will begin and end and how much will fall. But it does show the regions in which isentropic lift is forecast to occur, and with forecaster experience, can provide a degree of estimation as to how STRONG or how WEAK an isentropic event will be. For instance, if the gradient of blue lines were twice tighter such as 3 or 4 lines appearing between Grand Isle and St. Tammany/Washington parish border, instead of the 2 that are there, and if we had doubled the stronger winds from the southwest in direction, with a tighter gradient of moisture, then it can be safely assumed that even heavier rainfall rates would follow, and could even be accompanied by increased thunderstorms by which slantwise instability could develop. Instead of a vertically stacked air-mass thunderstorm, you instead get a sharply-angled low-topped thunderstorm. This very situation happened last year late one night on February 4, 2004. I can remember this very vividly as our friend Carl Arredondo from WWL-TV stepped outside to bring in pictures of golf-ball-sized hailstones from a severe thunderstorm that night in an incredibly powerful isentropic lift forcing event with a retreating warm front heading north that night. Okay, this is enough for now. Take a look again at the maps presented below and I think if you spend some time, you'll see that this isn't really that complicated of a concept. It's the preciseness of areal coverage amounts, locations, timing, and convective mode, (either stratiform, or convective cellular) that these maps do not tell a forecaster the full story. T. Scott |